Bitcoin has taken the financial markets by storm over the last year. But bitcoin prices are nearing an important juncture on the charts.
So prepare yourself for another big move.
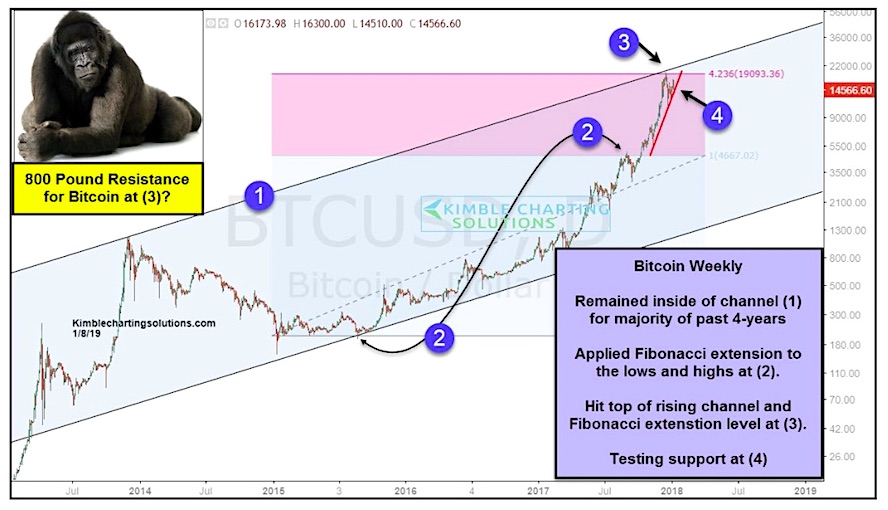
As you can see in the weekly chart below, bitcoin has remained in a broad channel for the last 4 years (point 1). The monster rally for bitcoin saw prices reach up to an applied Fibonacci extension level (point 2), meeting precisely at channel resistance (point 3).
Now bitcoin is testing its short term “steep” up-trend line (point 4).
Resistance overhead, support below. A big move is coming… just depends on which gives way!
Stay tuned..
Bitcoin Weekly Chart
Thanks for reading.
ALSO READ: Can Gold Bulls Capitalize On US Dollar Weakness
Twitter: @KimbleCharting
Any opinions expressed herein are solely those of the author, and do not in any way represent the views or opinions of any other person or entity.


