When we last wrote about CME Bitcoin futures (BTC) in August, we were expecting a larger pullback than what materialized. The climb to new highs in 2021 has caused us to reevaluate our Elliott wave count, and we see cases to be made for a moderately bullish forecast going into early 2022 and an alternative, even more bullish forecast. Here we show what traders can watch to determine which forecast is working.
Our primary scenario gives bullish traders an opportunity to catch an upward retrace of the decline from November, but with modest expectations of what would probably become a lower high. On the weekly chart below, we have marked that scenario using black wave labels.
The primary view has price moving up for a few weeks as a medium-sized retrace and then downward again during the next year as BTC works through a corrective second wave. The initial upward retrace from near the current area would represent the middle portion of a larger wave II that eventually takes price downward or sideways. In this view, price will probably stay within or near the fairly wide range defined by prior BTC highs and the summer 2021 low, although a slightly deeper decline is also possible.
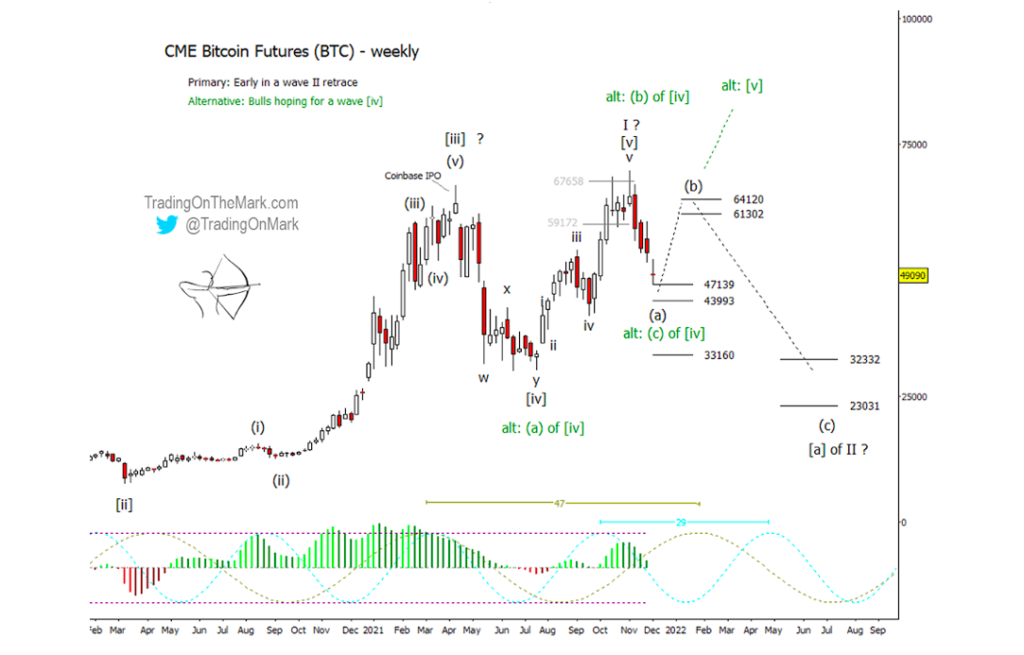
Note, the primary scenario requires that the climb from July into November should be impulsive, i.e. should consist of five non-overlapping sub-waves. The actual pattern from that time is a little ambiguous, as there’s some overlap of the candle wicks between sub-waves ‘i’ and ‘iv’. However the weekly opens and closes don’t overlap. We believe the pattern has more impulsive characteristics than corrective ones though, making it a candidate to be the final wave [v] of ‘I’ in the upward [i]-]ii]-[iii]-[iv]-[v] sequence that began several years ago.
If the primary scenario is working, traders could see a modest bounce from near the current area. Fibonacci relationships between the very recent decline and the April – July decline put possible supports for wave (a) of the correction at 47139 and 33160, and there’s another Fibonacci-based support between the two at 43993. Additionally the 23-week price cycle suggests a low is due within the next few weeks.
A bounce from nearby, confirmed by a higher weekly close, opens the door to a possible upward retrace to test the area near 61750 and 64325 resistance levels. However if a bounce breaks above that standard retracement area and starts taking the form of an impulsive wave, we would probably switch to the alternative scenario that has price going up to new highs in [v] of ‘I’.
On the other hand, if resistance ends up capping an early-2022 bounce, we would look for downward wave II to resume with provisional support targets at 32332 and 23031. There’s a confluence of lows in the 29-week and 47-week price cycles around August 2022 that could mark completion of the large corrective pattern.
Keep in mind that currencies can trade within a range for years at a time, and moves that break out of the range are rare. Anyone approaching this market with a trading mindset should be prepared to let go of positions after each swing has played out.
You can get daily charts and updates for this and other highly traded markets via our subscription page on Substack and on Twitter. Take advantage of our holiday price special and save 20% on any type of subscription.
Twitter: @TradingOnMark
The authors may have a position in the mentioned securities at the time of publication. Any opinions expressed herein are solely those of the author, and do not in any way represent the views or opinions of any other person or entity.


 Ready To Break Out?")


 Rolling Over At Key Fibonacci Level?")
