The biotechnology industry appears to have completed a transition from accumulation to consolidation to distribution.
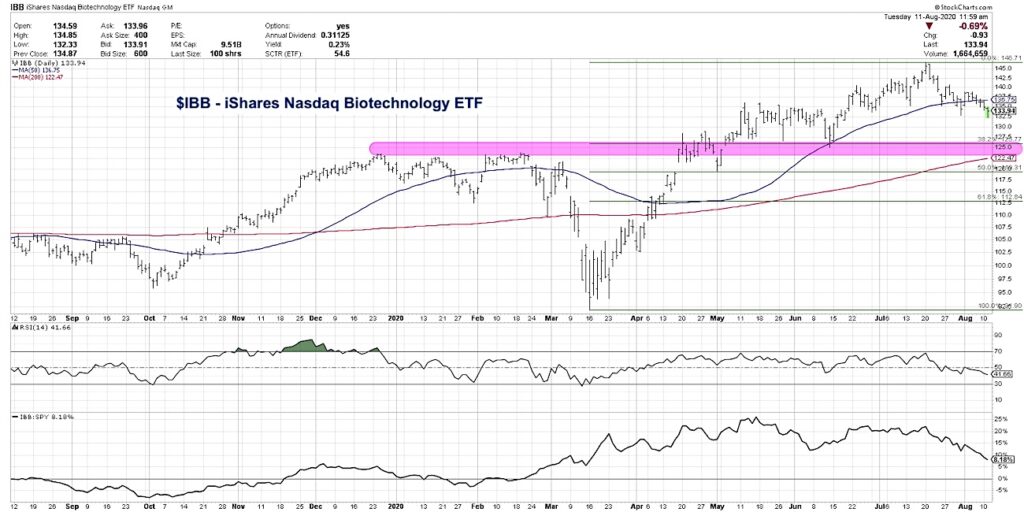
A confluence of price support levels around $125 for the iShares Nasdaq Biotechnology ETF (IBB) give a clear potential downside target as further weakness appears likely.
Biotech stocks are a fascinating industry group from a technical perspective because the ETF chart looks very different than the average stock for the last eight months.
The Biotech Sector ETF (IBB) actually topped out in December of 2019, while most stocks topped in January or February 2020.
A rebound into February created a double top pattern before the IBB sold off to reach a low around March 16th, a week before the broader stock market indexes.
Most importantly, biotech stocks outperformed through the downturn into the March lows and also outperformed from the low to a peak in early May. Essentially, the group became “good offense and good defense”, meaning it outperformed in both bull and bear cycles. Not bad.
Everything changed, however, in mid-May. While most stocks rallied into a June high, the IBB remained rangebound. Then the biotech group rallied in late June while most stocks were pulling back from their early June high.
In recent weeks as the S&P 500 index has approached the “ultimate resistance” level of 3400, biotechs have been rotating lower. This has pushed the relative strength from a sideways trend to a new five-month relative low.
During the June-July uptrend, the IBB successfully tested an ascending 50-day moving average and bounced off it in mid-May. That’s a classic “buy on the dip” pattern and it worked out fairly well. In the last two weeks, however, the biotech ETF has now broken down through that same 50-day moving average for the first time since early April.
Over the last three months, the $135 level has served as resistance in May and support in June and July. That key support level was broken in recent weeks and completed a short-term rotation from consolidation phase to distribution phase.
So what now?
If the IBB continues its current pattern of the short-term lower highs and lower lows, the next downside objective would be around $125. This represents the confluence of three independent but meaningful technical indicators.
First, the $123-125 range was the peak reached in December 2019 and was retested in February 2020. This same price range served as support during the pullback in June 2020. Especially on the weekly chart, this support level almost jumps off the page as support.
Next, $125.77 would be a 38.2% retracement of the March-July uptrend, so now we have a second approach that lines up beautifully with the traditional support/resistance methodology.
Finally, the 200-day moving average is currently rising and has reached around $122.50. By the time the price gets down to these levels, the 200-day moving average should be right in that same support range as described above.
When you have a confluence of support derived from three different methodologies, it tells me that it’s a high probability as a legitimate downside objective. If and when the price hits this price range, I’ll be looking at three specific data points:
1) What does the price do when it reaches this level? Do I see any evidence of a lightening of selling pressure or an increase in buying interest?
2) Has the RSI remained above 40 during this down leg? During bull market phases, the RSI tends to remain above 40, even during pullbacks. Has this remained true?
3) What is the trend in relative strength? Has the IBB continued to underperform other industry groups?
By answering those three questions, I should have a good sense as to the market dynamics leading into that price objective, and a strong sense of the most probable next steps as the price pattern continues to evolve through year end.
To see this article in video format, check out my YouTube channel!
Twitter: @DKellerCMT
The author may have a position in mentioned securities at the time of publication. Any opinions expressed herein are solely those of the author, and do not in any way represent the views or opinions of any other person or entity.


