The stock market rally continued to show strength into Friday moving decisively higher on the week.
Big tech and many other sectors shrugged off a post-Fed pullback plus some earlier in the week, bad earnings and poor guidance from Wal-Mart, Meta, and Qualcomm to mention a few.
With Amazon, Apple, Microsoft all doing “better than feared”, even the “R” word could not stop the train in the indices, junk bonds and most sectors.
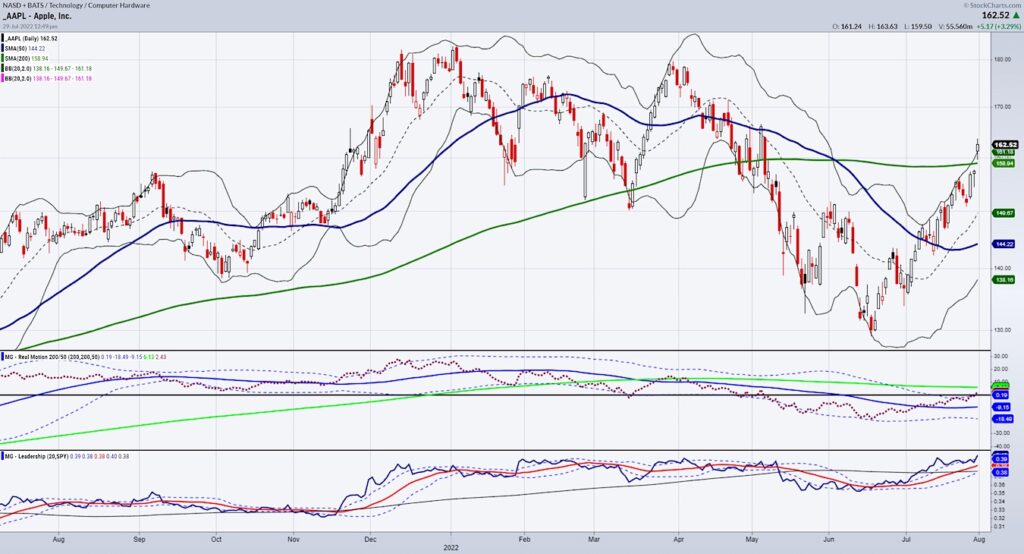
Apple, considered a bellwether, saw shares gain thanks to strong iPhone sales, mainly in India. Consequently, technology investors should continue to monitor Apple for further signs of strength or weakness in technology and consumer demand.
Amazon’s stock also rose. The e-commerce giant exceeded sales projections. Sales increased 7%
Both stocks (AMZN and APPL) eased concerns about the technology sector.
Furthermore, First Solar (FSLR) shares gained another 12% on top of the 15% Thursday on both an outperformance of the EPS and sales but also because of the potential progress made by Congress on legislation that includes solar and green-energy subsidies. The bill has a long way to go however to become reality.
With all this good news, what might we expect from here?
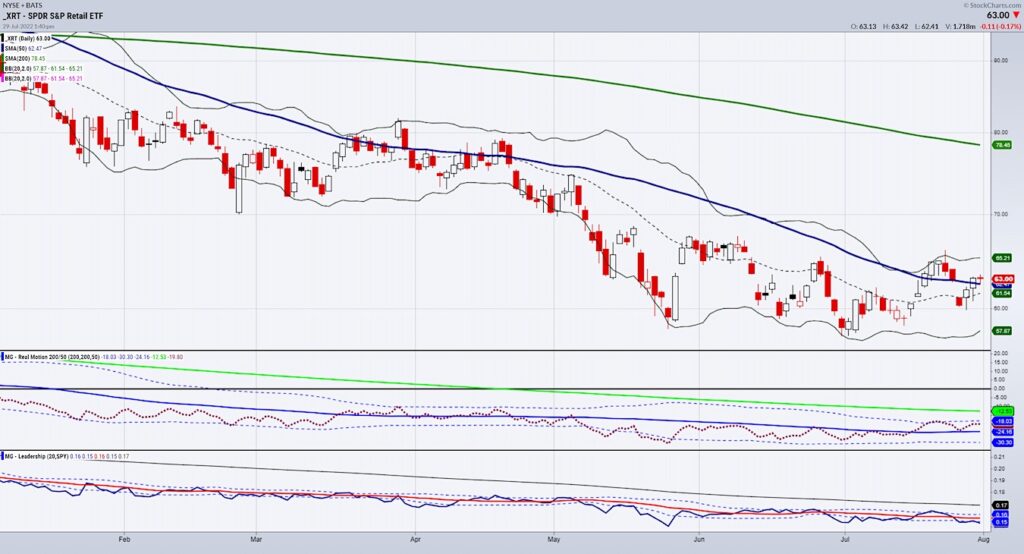
Not everything is coming up roses in the consumer sector as reflected by Granny Retail (XRT).
Some companies did way worse than expected. Intel (INTC), META, and Roku (ROKU) were noteworthy with deep declines. All dropped in price precipitously due to low demand, poor advertising sales and falling revenues.
And Granny Retail is doing ok, but not really buying the euphoria, at least not yet.
Looking back at the chart of AAPL, we an see that 170-175 is huge resistance. And now that the price cleared 158, that level has to hold up.
In XRT, given the rise of both AAPL and AMZN, the price action is more meh than heck yeah! The XRT price has cleared back over the 50-DMA. The momentum shown by our real motion indicator has improved to a degree. XRT still underperforms the benchmark.
Friday, consumer sentiment showed some improvement. Nonetheless, we need to see more from our consumers.
As we head into this coming week, we must continue to watch three key indicators:
Stock Market ETFs Trading Analysis & Summary:
S&P 500 (SPY) 403 now closest support with 417 resistance
Russell 2000 (IWM) 182.50-183.50 support-maybe move to 190 next
Dow Jones Industrials (DIA) 322-323 support now 331 next resistance
Nasdaq (QQQ) A weekly close over 308.55 should keep the party going with resistance 317
KRE (Regional Banks) 60 key support-65 resistance
SMH (Semiconductors) 230 now pivotal support 237.50 some resistance
IYT (Transportation) The demand side tran sector cleared the base and now must hold 229.50
IBB (Biotechnology) 125 key to close above
XRT (Retail) 62 now support to hold with 66.25 big resistance
Twitter: @marketminute
The author may have a position in mentioned securities at the time of publication. Any opinions expressed herein are solely those of the author and do not represent the views or opinions of any other person or entity.


: Showing Some Signs of Emerging Strength")
