What is a bearish divergence, and what does it tell us about price momentum? Here we will review the chart of the semiconductor ETF (SMH) and discuss why future textbooks on technical analysis will feature this chart. What would confirm a bearish rotation for this key bellwether industry group?
In today’s video, we’ll break down the chart of semiconductors and relate today’s pattern with previous market regimes.
Here’s 3 things we discuss in the video:
How bearish divergences represent waning momentum in late bull market phases
The danger of “false positives” on stocks like Tesla and how to combine divergences with price breakdowns and moving averages
How the current pattern relates to another key bearish divergence in February 2020
Watch the video for more insights… and chart below for quick takeaways.
For deeper dives into market awareness, investor psychology and routines, check out my YouTube channel!
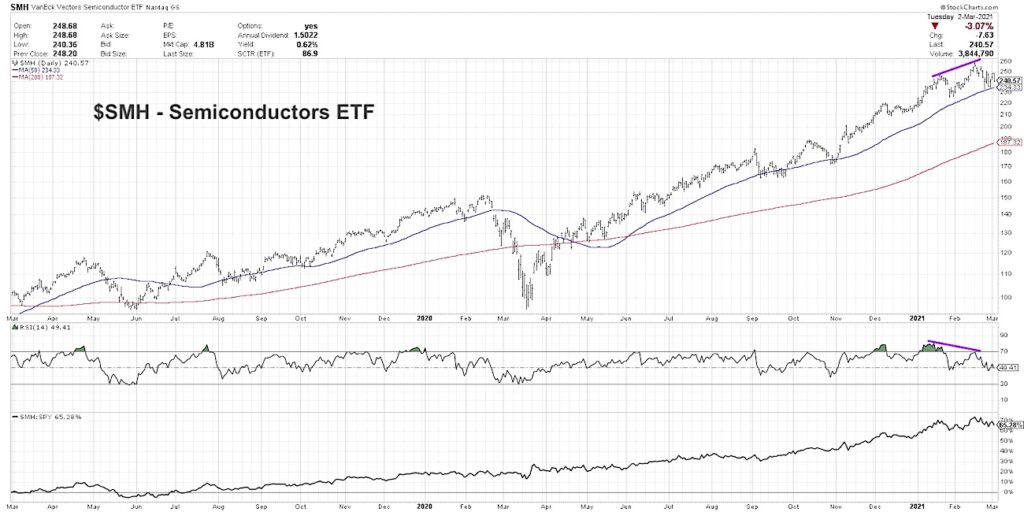
One Chart: $SMH Semiconductors Sector ETF [VIDEO]
$SMH Semiconductors ETF Chart
Twitter: @DKellerCMT
The author owns a long position in ATVI at the time of publication. Any opinions expressed herein are solely those of the author, and do not in any way represent the views or opinions of any other person or entity.
Editor’s note: This post was updated March 9, 2021 at 7:10 am central time to correct the video embed link.


