I last posted on the Banking Index and the potential for a peak at the end of January. You can view that post here.
Well, today I’m sad to say that it played out as one might have thought… and banks have been declining sharply of late.
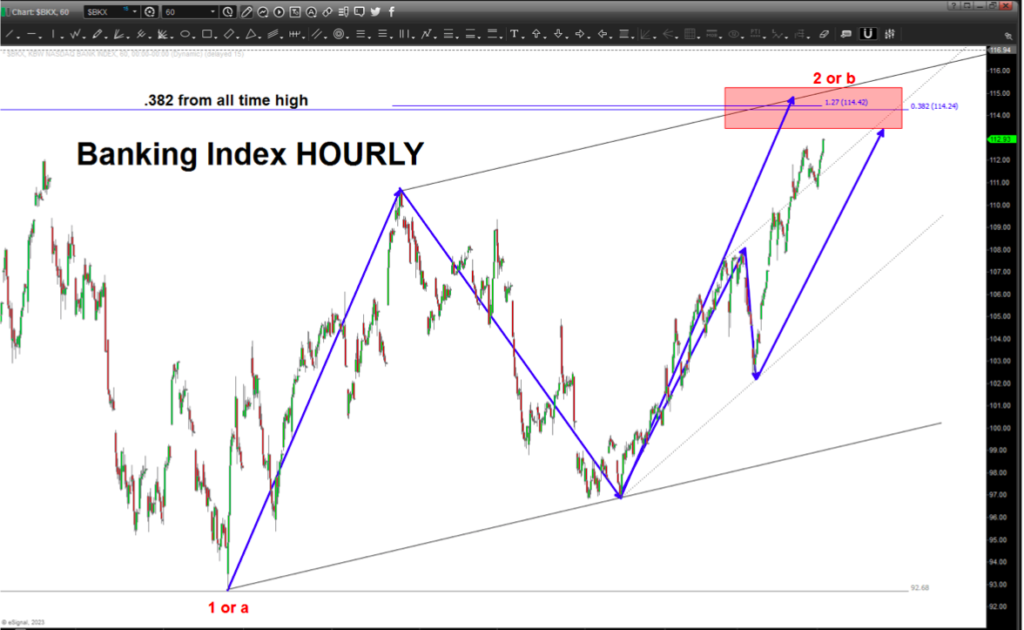
So today we provide another update. Just for reference, below is the chart from my previous blog (showing the topping setup).
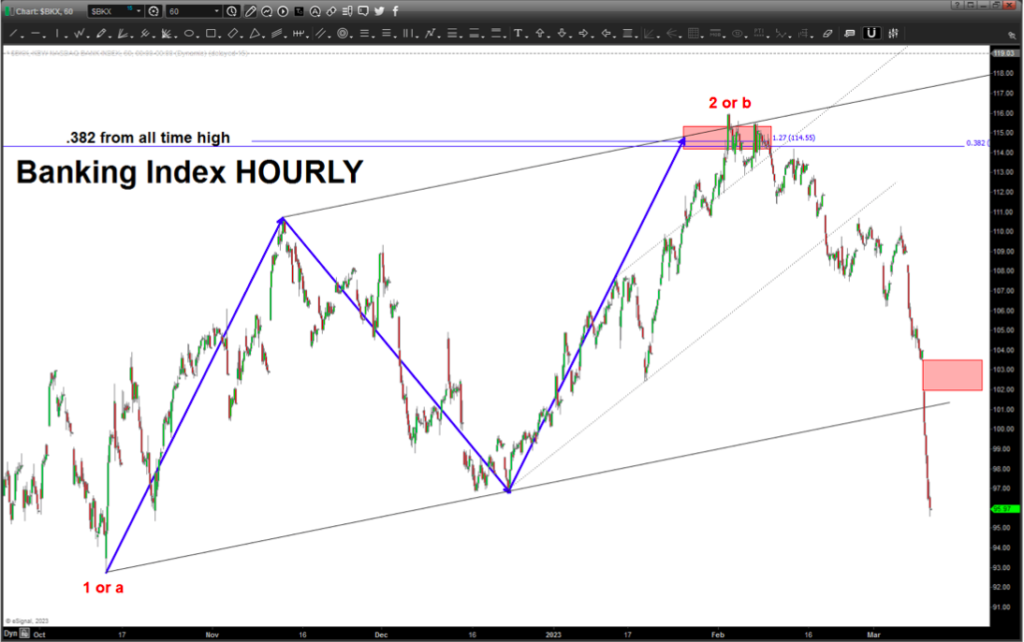
Folks, banks are everything. PERIOD. They lead us UP and they lead us DOWN. Something isn’t right at the circle K. Below is the Updated Chart.
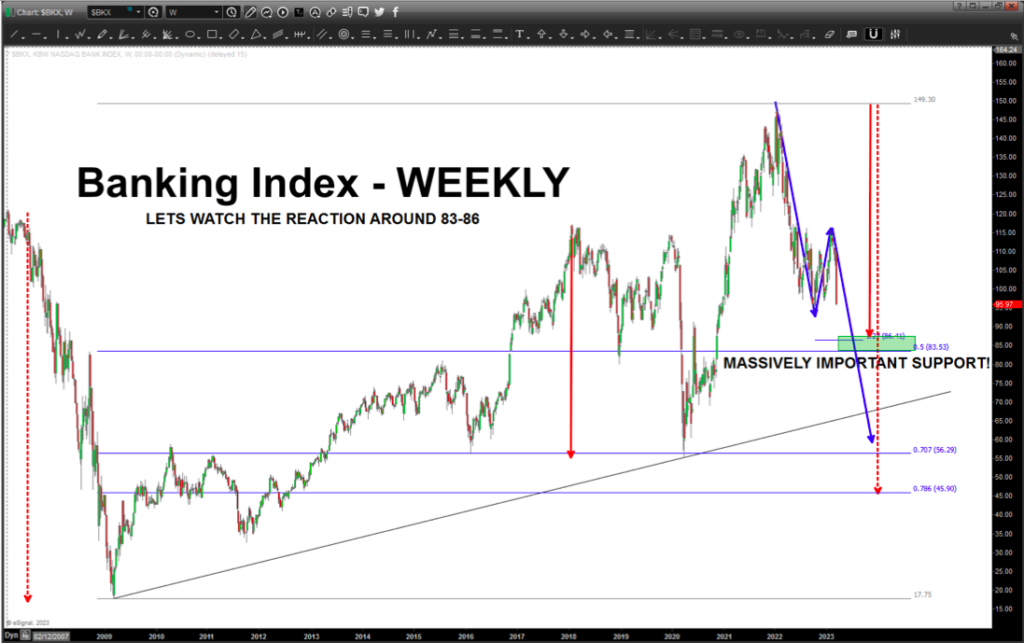
All things being equal, the wave that started today needs to finish 5 waves so I would step aside and let the banks pave the way … the BIG support is 83-86. Why? The red arrow is the largest price correction in the banking index since 2009. What happens at that level will be very key.
Next levels are the measured move down around 56-60 and the BIG ONE at 45-46.
Get your tinfoil hat peeps .. buckle up.
Be sure to check out my unique analysis of stocks, commodities, currencies over at Bart’s Charts. Stay tuned and thanks for reading.
Twitter: @BartsCharts
Author does not have a position in mentioned securities at the time of publication. Any opinions expressed herein are solely those of the author, and do not in any way represent the views or opinions of any other person or entity.


