The SPDR Financials Sector ETF (XLF), is dominated by big-cap financials. Its top five holdings include Berkshire Hathway (BRK.B), 8.6 percent; WFC, 8.5 percent; JPM, 7.9 percent; BAC, 5.8 percent; and C, 5.4 percent.
For our purposes here, XLF suits better than the SPDR KBW Bank ETF (KBE). The latter is dominated by regional banks, accounting for nearly 78 percent. At 1.8 percent, its top weight goes to First Niagara Financial Group (FNFG). C has only been given 1.64 percent weighting, BAC 1.59 percent, WFC 1.58 percent, and JPM 1.57 percent. This is the reason why KBE acts like KRE, the SPDR KBW Regional Banking ETF.
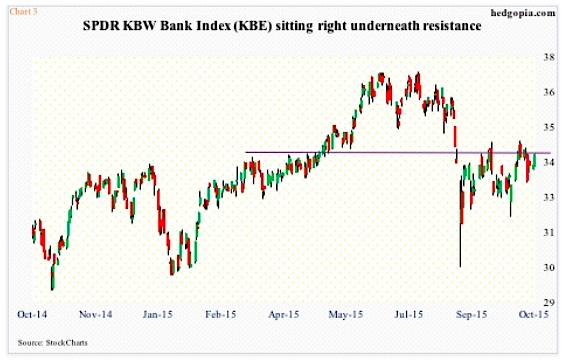
With that said, both XLF and KBE are approaching crucial resistance. KBE is sitting right on $34, which has proven to be an important price point of duel between bulls and bears going back to March last year (chart 3 above). On Tuesday, it pushed above its 200-day moving average.
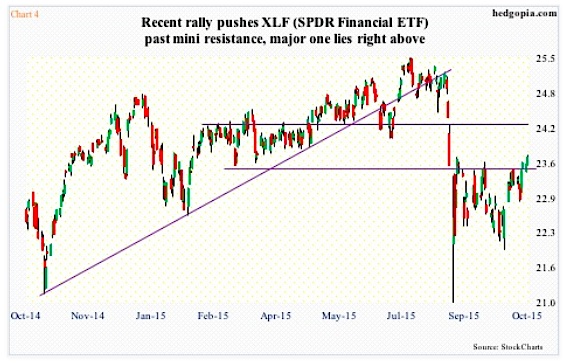
Similarly, XLF faces major resistance at $24-ish. The ETF is above mini-resistance at $23.50, as well as its 50-day moving average, but a major one lies right above. Resistance goes back to November last year (chart 4 above). As well, the 200-day moving average lies at $24.02.
If the post-earnings stock price action by big banks and brokers is genuine, then XLF should be able to break out of this resistance sooner than later. Although, at least near-term, the odds do not look good, given how stretched daily conditions are.
Thanks for reading.
Twitter: @hedgopia
Read more from Paban on his blog.
No position in any of the mentioned securities at the time of publication. Any opinions expressed herein are solely those of the author, and do not in any way represent the views or opinions of any other person or entity.


