Last week, we took a dive into a key volatility ratio that traders can use for timing equity trades.
Recap: In last week’s article, we examined the ratio of the CBOE VXST Short-term Volatility Index (INDEXCBOE:VXST) to the CBOE VIX Volatility Index (INDEXCBOE:VIX).
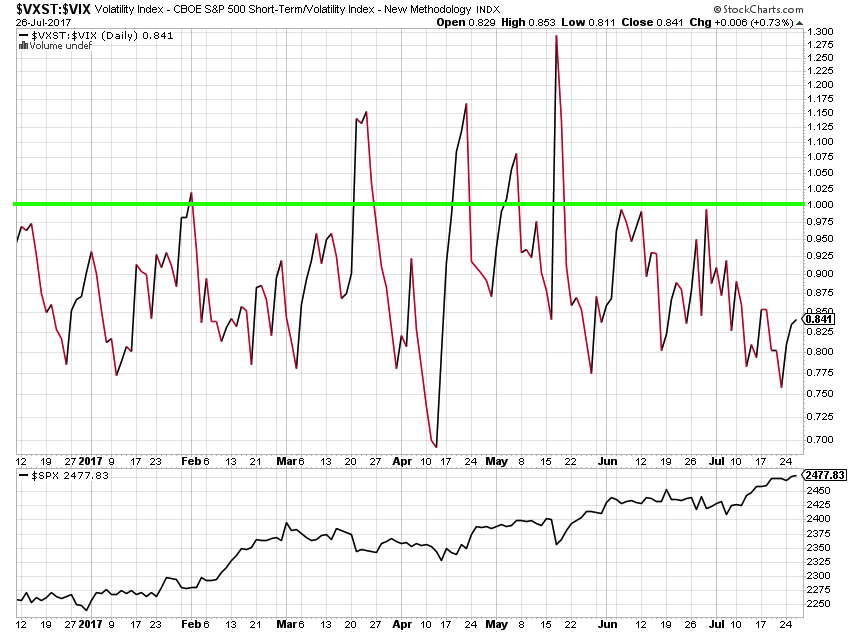
As you can see from the chart below, a spike above 1.0 in the ratio and a subsequent move back towards 1.0 tends to coincide with a near-term low in the S&P 500 Index (INDEXSP:.INX). But to see if we can take a simple chart observation and create a viable trading program, we need to crack open the Excel and run some preliminary numbers.
A few caveats before we begin: This is not a trading system. It is simply a few math exercises to see if our entry criteria warrants further exploration. To keep the focus on the entries (which are a small element in the overall success of a trading system), we tested the signals across a range of holding times, from 5 days to 30 days. No dynamic exit logic, no scaling or position sizing, no stop levels. The results below include all trade signals, including concurrent ones (i.e., if the signal fired on day one and then again on day three, we opened both and held them for the allowed number of days). With that, let’s look at the numbers.
Initial Tests:
We started by looking at the VXST to VIX ratio from January 2014 to present. During this time, the SPY ETF climbed from 181 to 247, returning approximately 36%. If we are going to find a trading approach using this ratio, we’ll be looking for signs that we could deliver greater gains than a buy and hold approach with preferrably lower volatility. And we would need to overcome trading costs. Not an easy task.
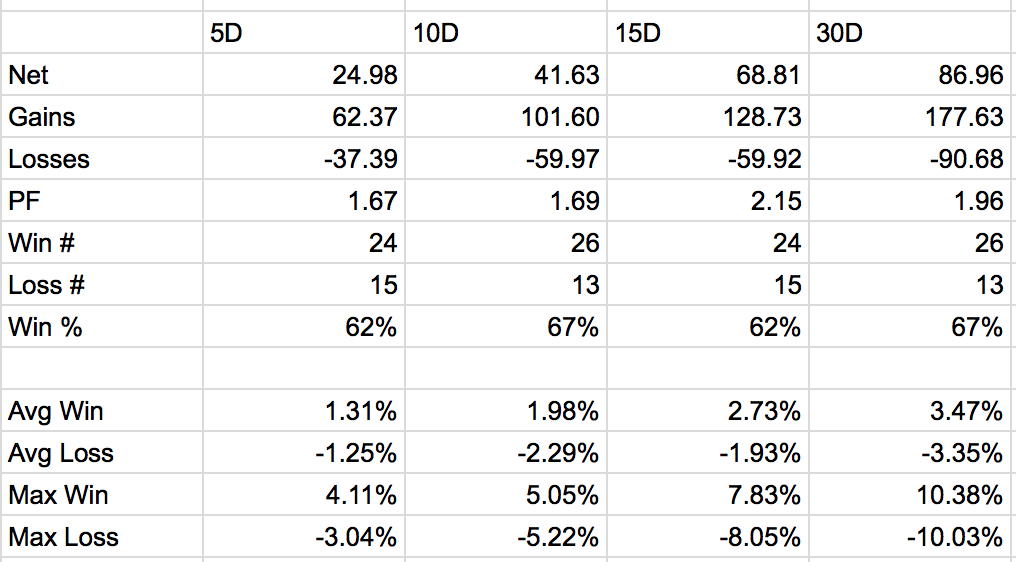
Our first preliminary test looked at going long the SPY ETF when the VXST to VIX ratio peaks over 1.0 and then recedes back below 1.0. We then tracked the performance of the SPY position for 5, 10, 15 and 30 days. Because of the short term nature of the ratio, this initial test produced a large number of trades with a nearly equal number of negative and positive trades of similar sizes.
To smooth out the false signals, we next explored using a 3 day simple moving average rather than tracking the raw ratio value. When the 3 day MA dropped back below 1.0, we went long the SPY. This method decreased the number of trades and was profitable across all holding periods (5, 10, 15 and 30 days). The 15 and 30 day hold times exceeded the gains from buy and hold over the same period.
We ran the same test with a 5 day simple moving average and saw similar results.
With decent but not amazing results from the moving average approach, we looked for a way to identify when the ratio was just beginning to drop back down from the peak, getting us long SPY earlier than we would if we waited for the ratio to recede all the way below 1.0. So we tested a new entry method: go long SPY when the ratio climbs above 1.0 and then drops below the 3 or 5 day moving average. This allows us to go long when the ratio is above 1.0 but appears to be losing momentum.
This approach provided the best returns over the 15 and 30 day hiding periods. The 5 day MA slightly outperformed the 3 day MA in terms of win rate but the 3 day MA offered greater net gains. Getting into the trades helped most of our performance metrics.
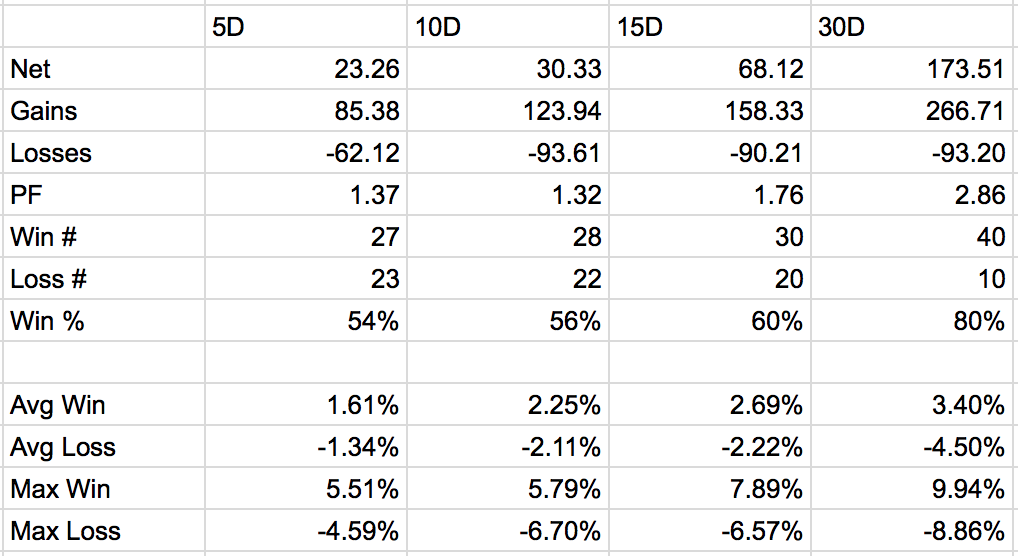
3 DAY
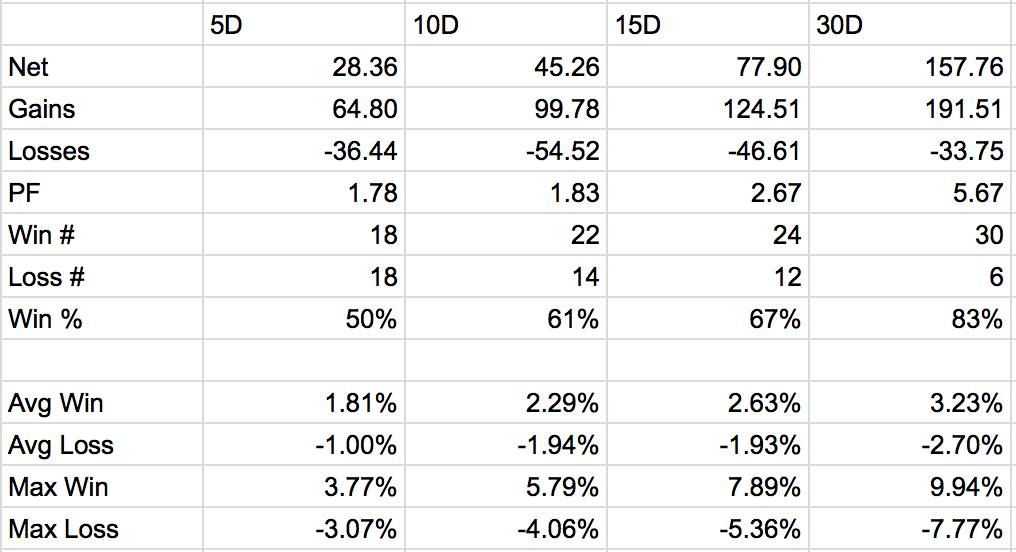
5 DAY
Conclusion:
The results from the preliminary tests are encouraging and suggest that the the VXST/VIX ratio can be used to improve entry points for long SPY positions (in a generally positive trending market environment). With the addition of smarter exits and some risk controls, we can further test the robustness of this approach.
In our next article, we will explore some other ways for traders to exploit the volatility ratio. Thanks for reading!
Any opinions expressed herein are solely those of the author, and do not in any way represent the views or opinions of any other person or entity.


 Testing Important Price Support")
")
