The Value Line Geometric Index tends to give investors a good idea of the health of the overall market.
It is an equal-weighted index with a broad swath of stocks that gives investors an idea of how the “average stock” is performing.
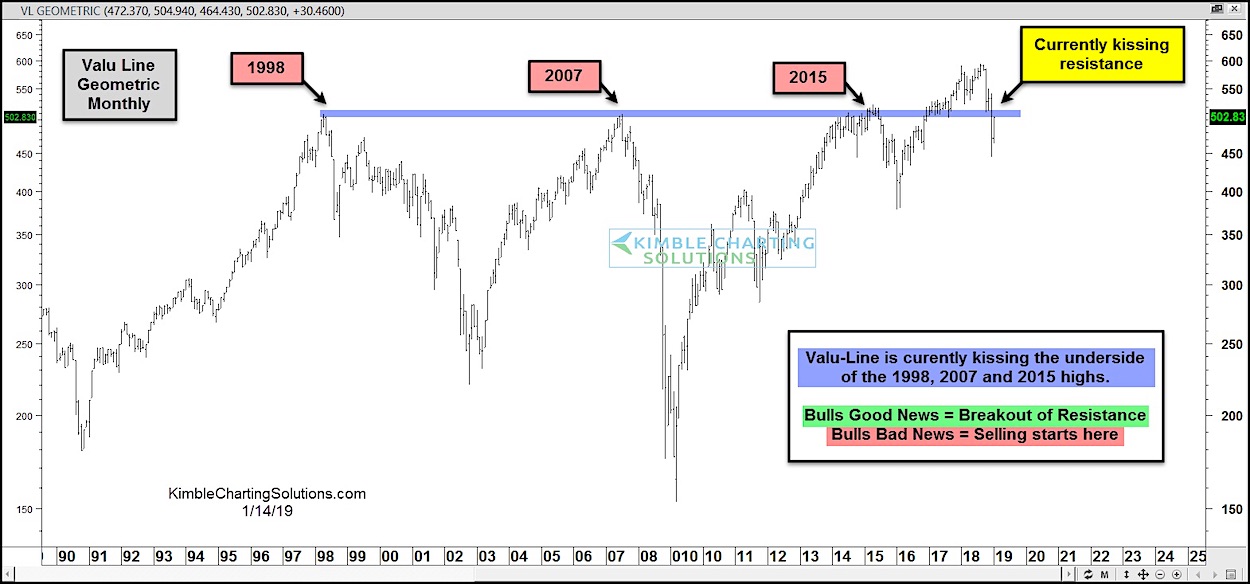
The Value Line Geometric formed highs in the same area in 1998, 2007, and 2015 (see blue line).
In the last two years the index broke out above that line and held above it until the recent correction.
It is now testing the underside of that price area (now resistance).
Bulls will get good news with a breakout ABOVE this resistance, while a failure BELOW resistance will be bad news.
Stay tuned. This is likely an important long-term price test for the average stock index.
Value Line Geometric Index “Monthly” Chart
Note that KimbleCharting is offering a 2 week Free trial to See It Market readers. Just send me an email to services@kimblechartingsolutions.com for details to get set up.
Twitter: @KimbleCharting
Any opinions expressed herein are solely those of the author, and do not in any way represent the views or opinions of any other person or entity.


: Showing Some Signs of Emerging Strength")
