Prior to the recent stock market volatility, the equity markets had enjoyed a strong two-month rally, lifting the S&P 500 Index INDEXSP: .INX to a new all-time highs as recently as July 26.
This advance was fuelled primarily by two factors: (1) anticipation of more accommodative central bank policies; and (2) an optimistic view of progress regarding ongoing trade disputes.
But both changed in the last several days. And it could be time for an August stock market correction.
The U.S. Federal Reserve cut rates on July 31, as expected, but the accompanying speech made it clear that the market should not expect this to be the start of an extended rate-easing cycle.
In other words, it could very well be a ‘one and done’ rate cut (we will see).
Clearly that is not what the markets wanted to hear. Then we had POTUS crank up the trade dispute following a meeting between senior officials in Shanghai. President Trump indicated the U.S. would add more tariffs on September 1, and poof the trade war is back on.
So, the positive factors that lifted markets higher over the past couple months have both reversed in the past week. This has caused the S&P 500 to drop almost 6% over the past five trading sessions, including Monday’s drop of 3%. It also doesn’t help that August to October is seasonally a weak period for equity prices.
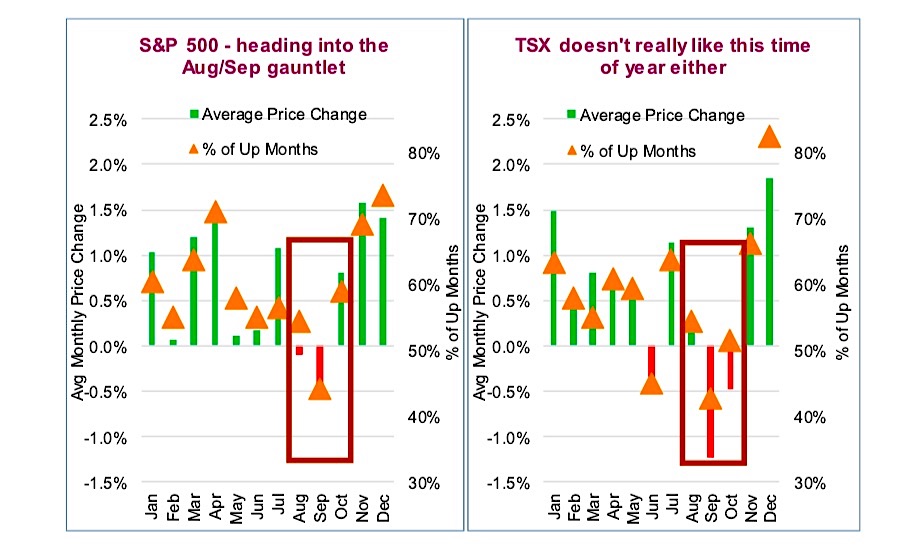
The charts below are the average monthly price returns for the S&P 500 and TSX Composite (green/red bars) based on data from 1950 through 2019.
Averages can be misleading, so we also included the frequency of positive price returns for each month. For the S&P 500, August and September have negative average returns coinciding with the lowest percentages of positive returns. The TSX, being slightly more volatile, also doesn’t do well during this time of year, skewed more towards September and October. If you believe in the seasonality of equity markets, this is the time of year to be a tad more fretful.
Correction Watch: Market fragility is elevated
We thought market fragility was high on Friday, so as you can imagine, it is worse now. At the moment this weakness has nothing to do with economic data, which has actually improved a little lately. The trade war that had been quietly simmering in the background just jumped to a flash boil over the span of 3 trading sessions.
When the market is confident it has this ability to absorb bad news and then continue along. Sometimes though, the market is not confident and any bad news is felt much more materially in equity prices. The current market appears to very little confidence and the bad news keeps on coming.
The Correction Watch indicators in our monitor work in two ways. When partially elevated, they indicate a market that is prone to or at heightened risk of a correction. That was probably a more applicable assessment on Friday. When things get really bad, these same indicators may reach extreme levels and become contrarian indicators for identifying a potential short-term market bottom. So here goes:
VIX (Chart 2): Equity market volatility is elevated but is still well below levels that often accompany a market bottom. While things could cool down as they did in May, the lack of confidence is being felt in higher market volatility. If this reached a 50 handle or higher that would be more inline with past market bottoms of this cycle.
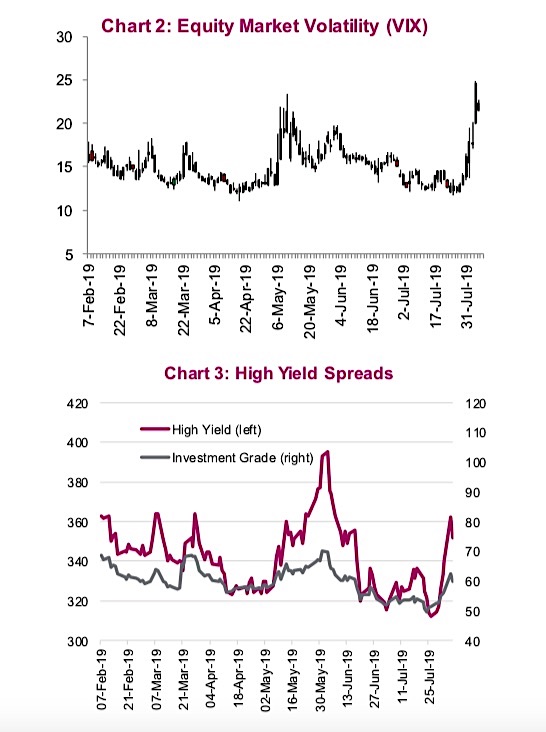
Spreads (Chart 3): Credit spreads have started to widen as investors price in added uncertainty. High Yield often moves first and fastest as these bonds, which are lower quality, tend to be more sensitive to risk. Currently spreads are elevated but nowhere near capitulation levels that are often above 500bps for high yield and 100bps for investment grade.
Equity/Bond correlations (Chart 4): This measures the correlation between equity and bond prices. When we are in a strong “risk-off” market environment, this correlation usually becomes strongly negative. As you can see, this has been moving in that direction for the past few weeks.
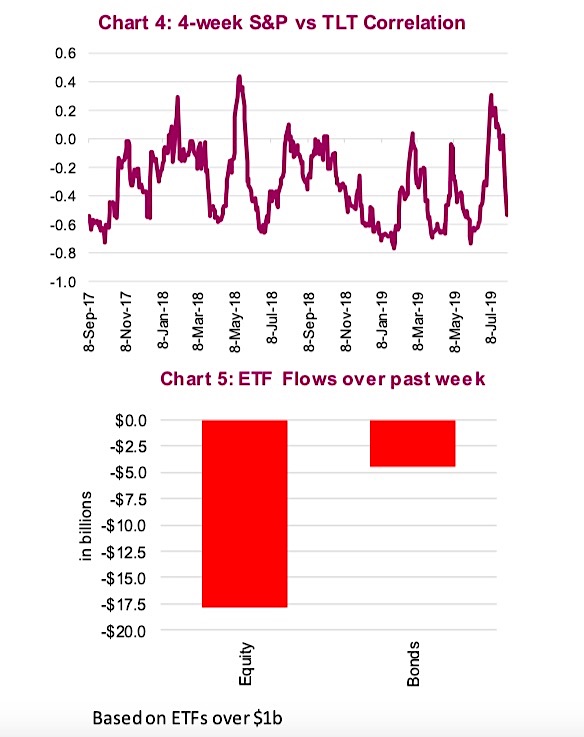
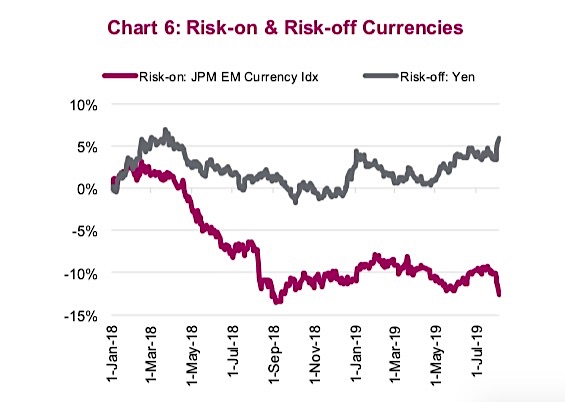
Market breadth has declined substantially with only 27% of S&P 500 companies trading above their 50 day moving averages. Weekly ETF equity flows indicate investors are pulling money out of equities ($18 billion) and even small outflows from bonds focused on corporate debt (Chart 5). Moves in the currency market are behaving as if we are in a strong risk-off environment (Chart 6).
Investment implications
This period of weakness could pass, or it could get worse. There, we have now completely hedged our opinion! The Monday drop was clearly overdone for a one- day change and we are seeing a bit of a bounce today. But let’s put things into perspective.
Over the past three years the TSX has provided an annualized return of 7.1%, the S&P 13.0% (even better if you look at in C$), EAFE about 5.5%, and emerging markets 4.2%. This market has provided some relatively handsome returns and the bull cycle is now over 10 years old. While our Market Cycle indicators remain decent (19 out of 33), there is a risk weakness in manufacturing/capex could spread with the recent trade uncertainty to the consumer/services.
We would not be rushing out today to become more defensive but we would also not be rushing out to be an opportunistic buyer. It is August 6th, in other words we are 6 days into the 3-month period that often see heightened volatility. Market fragility is elevated yet capitulation readings are still a ways off. Be tactical (notably ours) and hold onto your golds.
Source: All charts are sourced to Bloomberg L.P. and Richardson GMP.
Twitter: @ConnectedWealth
Any opinions expressed herein are solely those of the authors, and do not in any way represent the views or opinions of any other person or entity.


