The bull market in U.S. stocks is 8 years old.
After a harrowing 57-percent collapse that began in October 2007, the S&P 500 large cap index (INDEXSP:.INX) bottomed at an intraday low of 666.79 on March 6, 2009. Tuesday, it closed at 2368.39.
Table 1 is courtesy of Howard Silverblatt of S&P Dow Jones Indices, whose regular updates are a treasure trove of information.
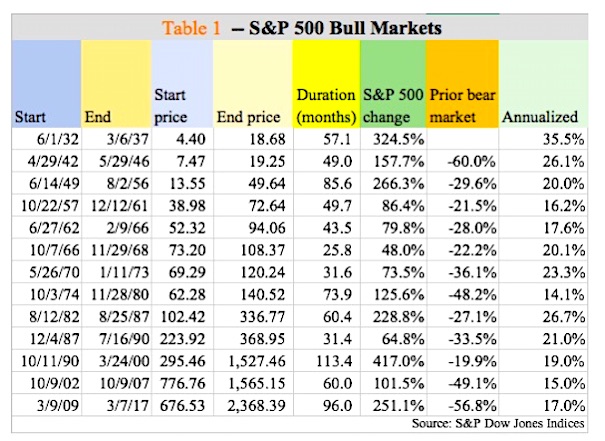
Thirteen bull markets going back to 1932 have been listed in the table. Duration-wise, at 96 months the current one is the second longest, but in terms of performance it is the fourth most profitable. Annualized, hence, current performance fares poorly – only outperforming three others (’57-’61, ’74-’80, and ’02-’07).
But the dogged persistence shown by this bull market during which the S&P 500 more than tripled deserves a lot of praise. The combined market cap of the index went from $5.8 trillion in March 2009 to north of $20 trillion. Multiple expansion helped. Big time!
Chart 1 below plots operating price-to-earnings ratio for the S&P 500, both trailing and forward – trailing until 4Q16 and forward from 1Q17-4Q18. On a trailing basis, things are stretched – 21x in 4Q16 (was 21.4 in 3Q16).
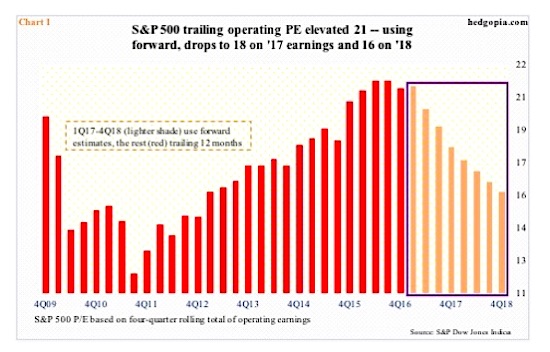
Things look better using forward P/E – 18.1x on ’17 earnings and 16x on ’18. The reason for the wide discrepancy between trailing and forward is because the latter remains elevated, which, given the prevailing downward revision trend, is hard to trust.
In February 2015, estimates for 2016 stood at $137.50; when it was all said and done, $106.60 was earned. Similarly, 2015 was expected to earn $137.50 in 2Q14 but ended up earning $100.45.
Even 2017 is not immune from this trend. In January last year, estimates were $141.11, versus $130.67 as of February 28 – still elevated. Not to mention $148.35 for 2018! Both 2017 and 2018 probably model in hefty corporate tax cuts.
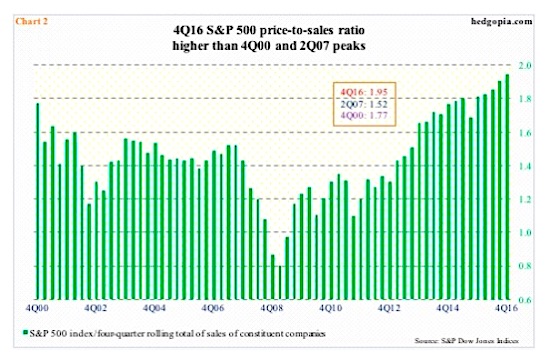
From the valuation perspective, the problem is not just on the bottom line, but the top line as well.
From 0.8 in 1Q09 to 1.95 in 4Q16, the price-to-sales ratio for the S&P 500 companies has come a long way. (In early 2000, it was north of two.) The economy – both the U.S. as well as global – needs to do a 360 and begin to accelerate for the S&P 500 to grow into these multiples. Given the U.S. economy is just four months short of completing eight years of recovery, it is hard to bet on this outcome.
Particularly post-November 8 U.S. presidential election, stocks have been on fire. Literally. The S&P 500 rallied 12 percent in just four months. President Trump’s promise to increase infrastructure spending, cut regulations and cut taxes gave stocks a fresh tailwind.
Something else happened last November. Bulls defended the rising trend line from the afore-mentioned low in March 2009.
That trend line has been tested several times – most prominently in January/February last year. In the early weeks of 2016, stocks seemed to be unraveling, as the S&P 500 lost nearly 13 percent in three weeks, later bottoming on February 11 – an important low. See chart below.
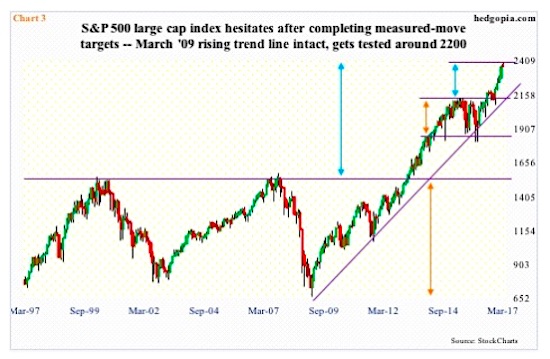
Will the trend line be tested in the near future? Too soon to tell. The S&P 500 has come under slight pressure since gapping up on March 1 to a new intraday high of 2400.98. The index is retreating after fulfilling not one but two measured-move targets. The trend line does not get tested until around 2200, which is another seven percent. That is a lot of cushion for the bulls to work with. If they manage to save it, Charts 1 and 2 – no matter how extended – probably stay that way.
Thanks for reading!
Get more research and ideas from my website hedgopia.
Twitter: @hedgopia
Author may hold a position in mentioned securities at the time of publication. Any opinions expressed herein are solely those of the author, and do not in any way represent the views or opinions of any other person or entity.


: Showing Some Signs of Emerging Strength")
