Already declining US treasury bond yields plunged even lower during the initial coronavirus / COVID-19 crash in early 2020.
That plunge lead to a spike bottom and bond yields (and interest rates) have since moderated and pushed higher.
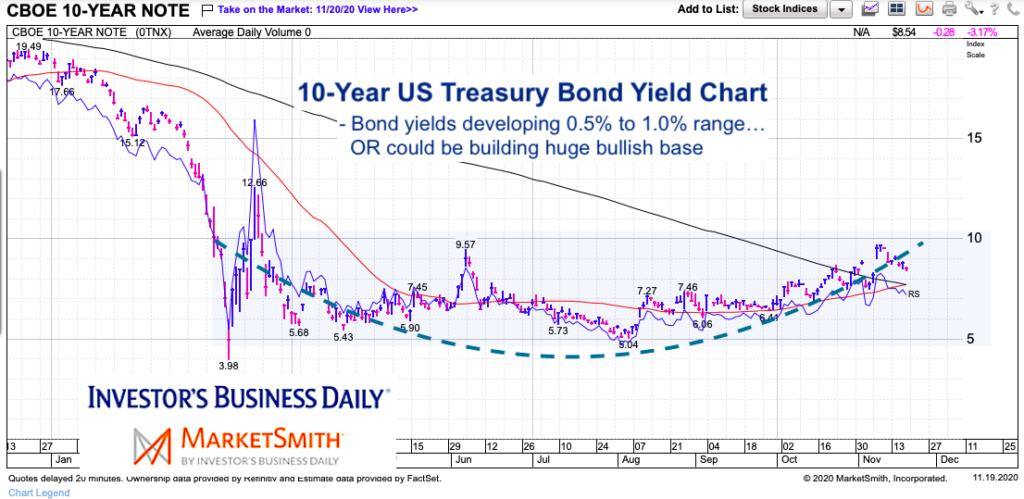
The rally may seem small when factoring in a move from 0.5% to 1.0%, but the fact that it occurred over a 9 month span supports the possibility of base building.
Today’s chart spotlight shows investors what to watch for here… and explains why it’s important.
Note that the following MarketSmith charts are built with Investors Business Daily’s product suite.
I am an Investors Business Daily (IBD) partner and promote the use of their products. The entire platform offers a good mix of technical and fundamental data and education.
10-Year US Treasury Bond Yield Chart
What’s clear here is that interest rates are testing the top of 9-month trading range. The 50-day moving average is rising and appears poised to cross the declining 200-day moving average (golden cross).
A breakout over 1 percent would be important and likely target 1.5%. That said, the declining 200-day MA should limit any initial breakout move. As well, it may be that US treasury bond yields (interest rates) need more time to consolidate in the range.
So why is this important to watch? Traditionally, low interest rates are good for lending (mortgage rates). That said, a breakout over 1.0% bond yields when the economy is uncertain (or in recession) isn’t a great sign for business… and may point to other issues with U.S. bonds / debt markets. Stay tuned here!
Twitter: @andrewnyquist
The author may have a position in mentioned securities at the time of publication. Any opinions expressed herein are solely those of the author, and do not in any way represent the views or opinions of any other person or entity.

: Showing Some Signs of Emerging Strength")
