Last week was another reminder that the ole “Summertime Trading” myth is basically extinct: we are officially in the dog days of summer yet the market price action is jam-packed with high volatility, wide trading ranges, and big volume reversals.
The S&P 500 ended the week only slightly higher but it was a wild ride for stocks that started with a rally through the 2100 level on Monday, followed by a two-day drop to 2050, and then a massive bullish reversal to return to the 2090 level.
Obviously, ending the week with little progress does nothing to change the overall technical picture and the market seemingly remains under pressure and in a state of indecision and uncertainty.
However, it would be short-sighted to dismiss Wednesday’s reversal as it provides the market with a solid short-term support level to work from. This could also be viewed as a sign of a possible change in character for stocks. But, again, keep an eye on last week’s lows.
Additionally, several sectors and market indices are showing signs of stabilizing or have reached and successfully tested important support levels. I would interpret these as signs that odds may be shifting in bulls’ favor and the bears cannot afford to be complacent here.
The following is a review of select sectors and indices.
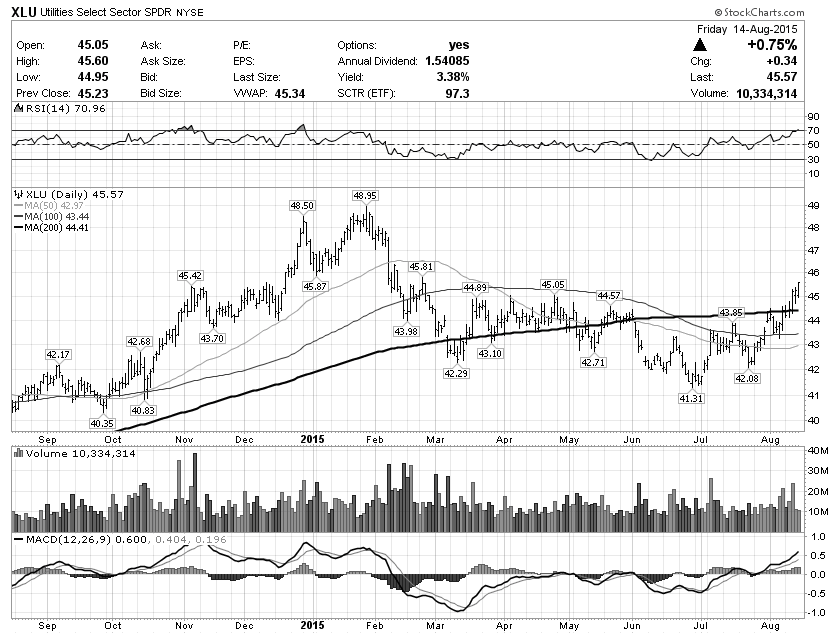
D-FENCE! – Utilities Sector (XLU):
Capital continued to rotate into defensive sectors and utilities continued to lead. The sector reclaimed the 200dma last week and seems ready for a move toward February highs.
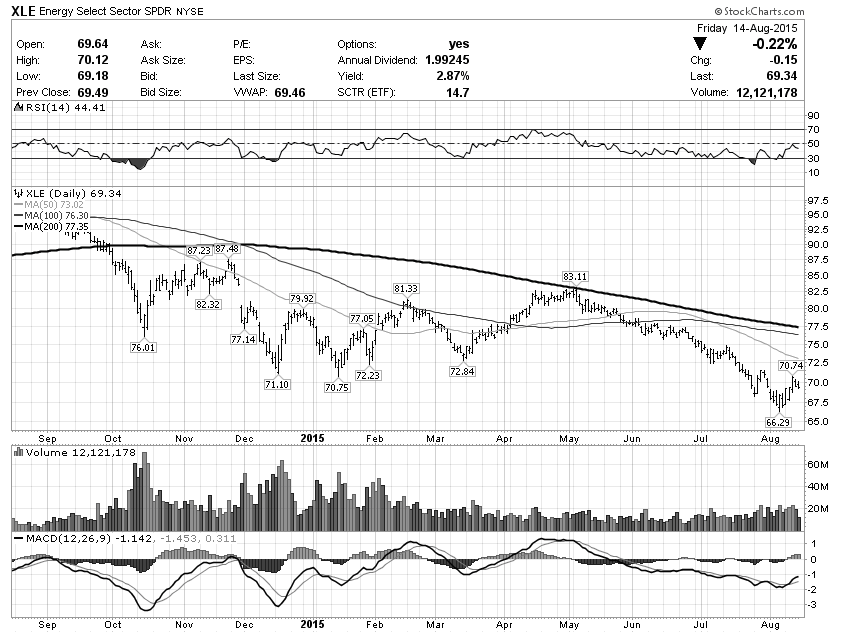
IS THIS THE BOTTOM? – Energy Sector (XLE):
This red-headed stepchild sector seems to have found a bottom around 66. It actually gained +3.5% last week despite oil finishing the week at new all-time lows. In my opinion this sort of a divergence is a bullish sign. Next we need to see a successful retest of the bottom or, alternately, a strong push higher.
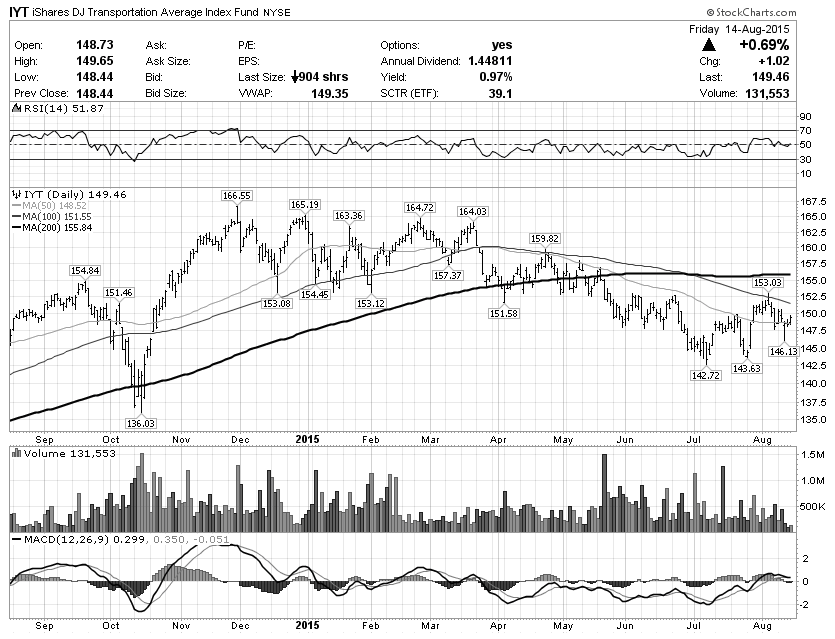
READY TO HIT THE ROAD? – Transportation Sector (IYT):
The overall price structure is still bearish (remains under the flattening 200 day moving average). However, over the course of the last two months the sector has put in a clear series of higher lows and is consolidating over the five-month downtrend line. All of these are constructive/bullish signs.
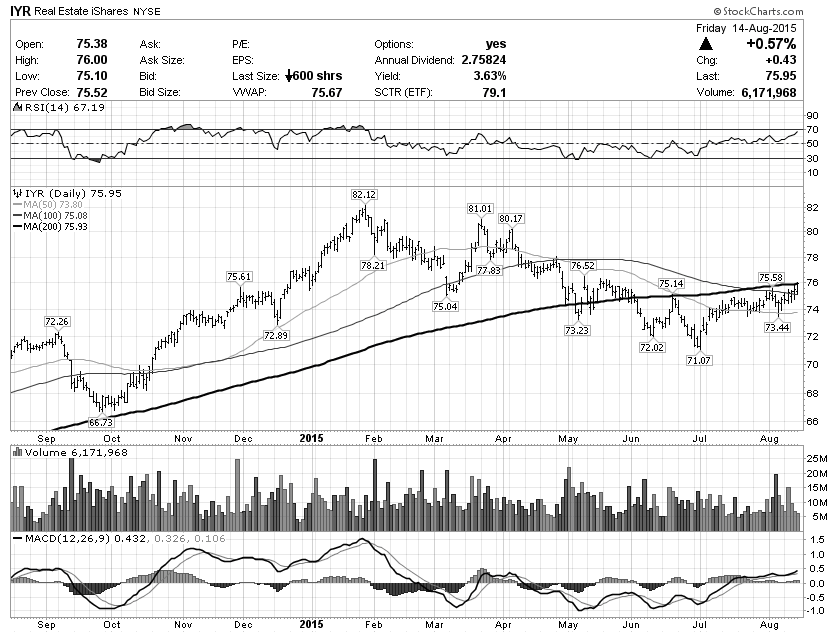
STEALTH STRENGTH – Real Estate Sector (IYR):
Real Estate stocks (via IYR) have spent the better part of the year in a downtrend. But the Real Estate ETF has recently stabilized and put in what could be an inverse Head and Shoulders pattern. Like the transports, this sector is now above the six-month downtrend line and the path of least resistance seems higher from here.
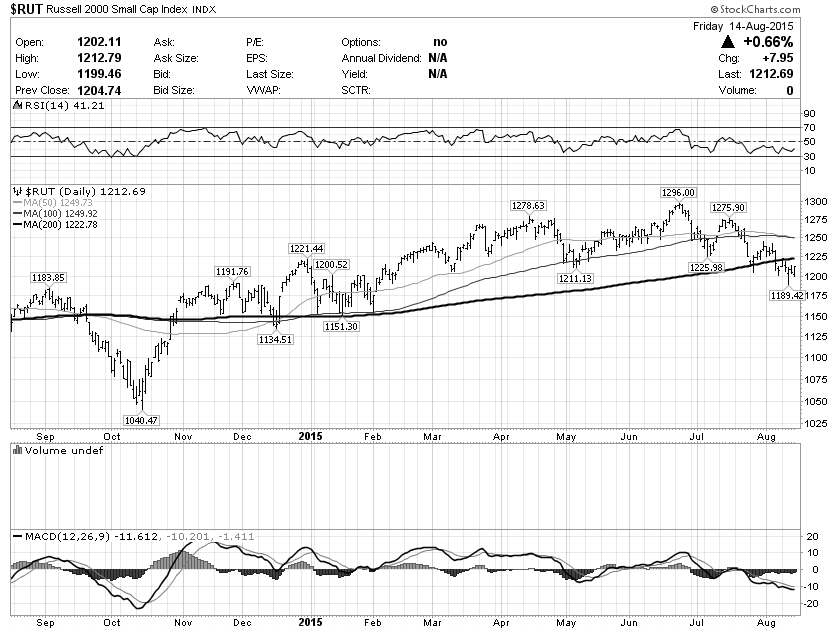
BULLISH WEDGE? – Russell 2000 Small Cap Index (RUT):
Small Caps are still technically in a downtrend, but there are also some bullish signs here. Price pattern over the last two months looks like a bullish falling wedge. Also bullish are last week’s reversal off 1190 and Friday’s bounce off 1200.
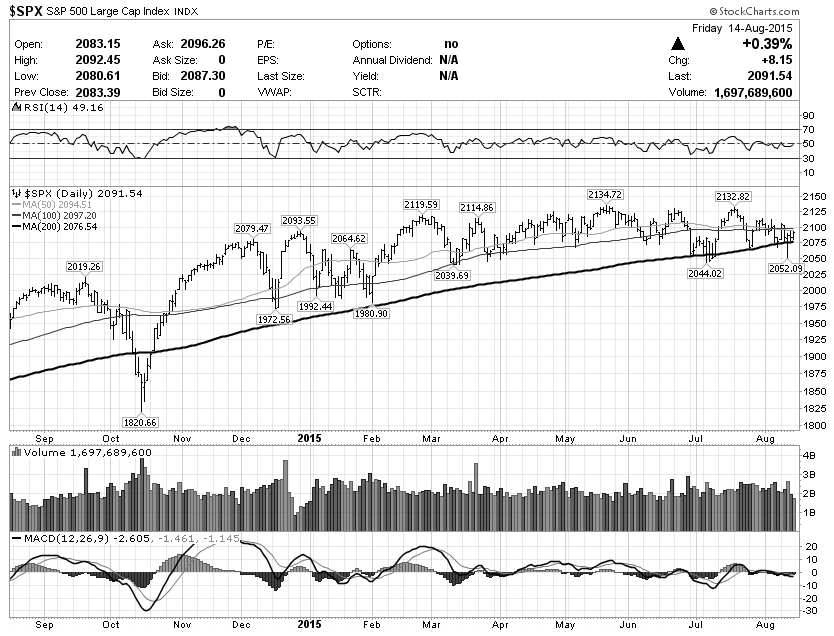
BEARS FAIL AGAIN – S&P 500 Large Cap Index (SPX):
The bears were again unable to break this index. The S&P 500’s strong bullish reversal off 2050 and another close above the 200 day moving average is yet another confirmation that momentum may be shifting toward the long side.
Check out my recent study for more insights on the bull market and moving averages.
Thanks for reading and good luck navigating the market this week.
Twitter: @NoanetTrader
Read more from Drasko’s blog, NoanetTrader.
Any opinions expressed herein are solely those of the author, and do not in any way represent the views or opinions of any other person or entity.


