 Background
In January of this year I took a “big picture” look at the market to see if there were any technical signs of the current bull market nearing the ultimate top (“Market Topping Process Revisited“).
This analysis was conducted by removing price information from the charts of three US equity indices and just looking at the interplay of the 50, 100, and 200 Day Moving Averages (DMAs). The objective of doing this was to filter out any shorter-term price pattern noise and better convey the longer-term status of the market.
Let me again reiterate the key points from the analysis:
- A bull market top is not an event. It is a long process that often unfolds over a period of 6-8 months.
- As a bull market nears its inevitable end, leadership becomes progressively narrower with fewer stocks making new highs.
- This narrowing leads to various equity indices topping in a progression: the Russell 2000 (small cap index) typically leads the way, followed by the S&P 400 (mid cap index), and finally the S&P 500 (large cap index).
- The 50 DMA crossing under the 100 DMA could be considered an early signal of the topping process, but it is not reliable unless confirmed by the 200 DMA also becoming flat or turning down.
- A top can be declared with certainty only in hindsight and once the 200DMA rounds over and starts declining.
The conclusion of January’s analysis was that there were no technical signs of a top for any of the major indices, despite widespread and consistent concerns over a host of fundamental or macro-economical issues.
This was confirmed by the subsequent price action and the major US indices advanced during the first half of 2015.
Current Market Status
As we start the second half of the year there are once again concerns over the health of the aging bull market and speculation about the top.
The first half of July was characterized with increased volatility due to a number of factors and led to the S&P 500 briefly trading under its 200DMA for the first time since October of 2014 (see below).
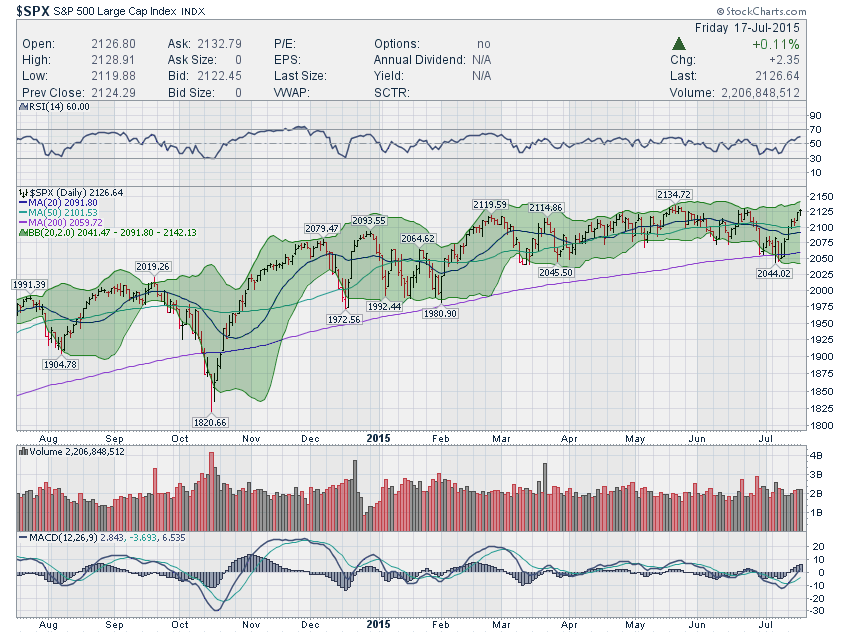
The indices subsequently had a strong bounce and the S&P 500 is again near its all time highs, while the small and mid caps appear to be lagging.
The above is obviously a short-term price analysis. What follows is the longer-term daily moving average analysis; identical to the one I did in January.
Longer Term View
Let’s start with a look at the ten-year chart of the Russell 2000’s key DMAs.
Before talking about what is going on right now, let’s briefly look at the left side of the chart (see below), which shows what the 2007/2008 top looked like. As you can see, it took some eight months back then for the index’s 200 DMA to peak and roll over, thus definitively confirming the top of the bull market that had begun in 2003.
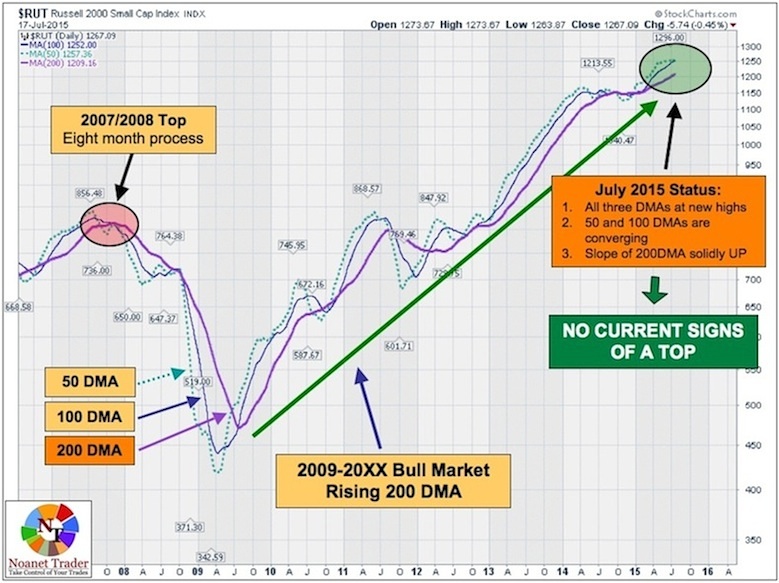
Fast forwarding to the present (the right side of the above chart) you can clearly see that, despite any short-term issues, the index is still very much in a longer-term uptrend/bull market:
- All three daily moving averages (50, 100, and 200) are at new highs
- The 200DMA is clearly slopping upward and shows no signs of flattening or turning lower
The only slight hint of a possible topping process could be the fact that the 50 DMA seems about to cross under the 100 DMA. However, as mentioned above, this is not enough to create a reliable topping signal unless accompanied by the 200 DMA also turning flat or down.
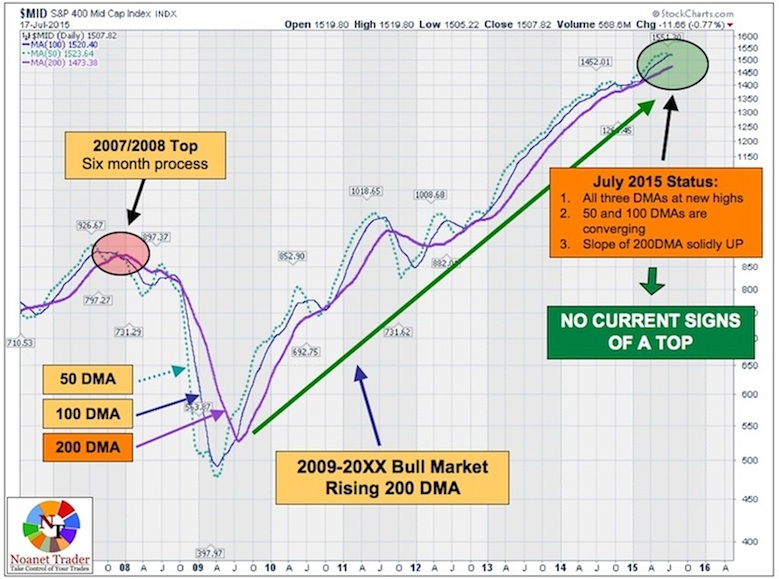
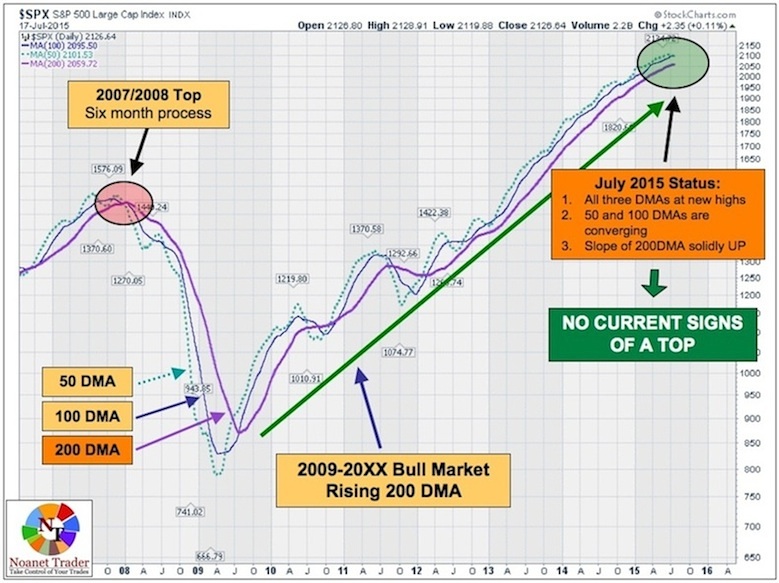
Applying the same analysis to the mid and large cap indices yields essentially identical results. These two indices are also in clear uptrends with the 200 DMA clearly sloping higher, and converging 50 and 100 DMAs (see below).
Conclusion
Despite any ongoing concerns, the current seven-year bull market is very much alive and kicking: it remains technically intact and there are no visible signs of a topping process.
All bull markets must end and this one will too but it is impossible to predict how much longer it will go on or when and how the ultimate top will be put in place.
Given the current status of the key daily moving averages, it is reasonable to expect additional gains over the coming months.
Even if this is somehow wrong and the top of this bull market has already been put in, we will not be able to declare this with any certainty for the next six months, which is when I again plan to revisit this analysis.
Good luck. Thanks for reading.
Twitter: @NoanetTrader
Any opinions expressed herein are solely those of the author, and do not in any way represent the views or opinions of any other person or entity.


