Small caps stocks have been a noticeable laggard for over 2 years.
But a recent year-end rally has set the Russell 2000 (IWM) on fire. Will this mark a change in performance going forward?
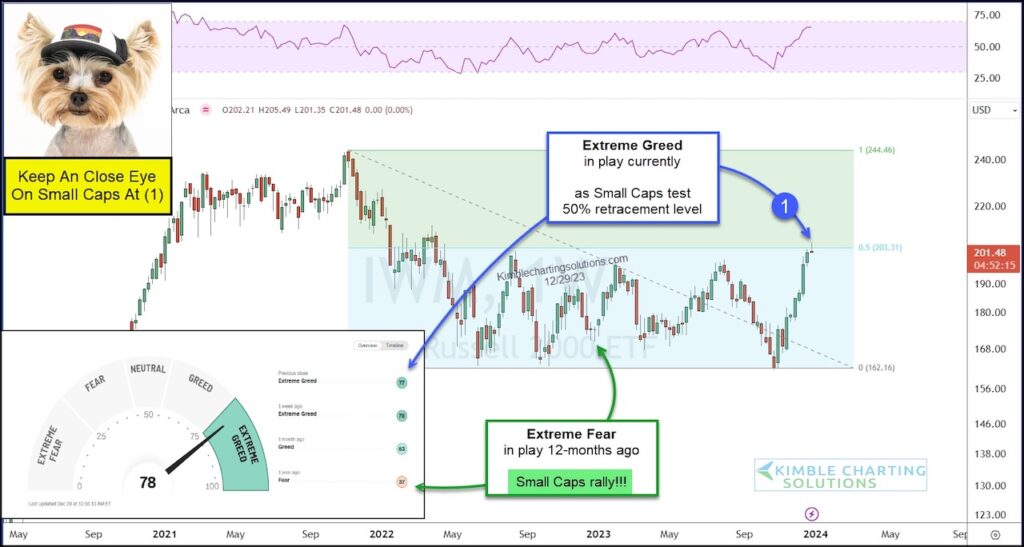
Today’s chart of the Russell 2000 ETF (IWM) highlights its underperformance (see blue shaded area where IWM has traded sideways for two years). The blue shaded area also represents the lower 50% of the high to low).
Note that the recent sharp rally has the Russell 2000 testing the 50% retracement line at (1)… and this is occurring as SentimenTrader trading sentiment reaches Extreme Greed. Just as Extreme Fear has marked bottoms in the past, Extreme Greed may be marking a top here.
In my humble opinion, it may just be important what this 2-year market laggard does at (1).
$IWM Russell 2000 ETF Chart
Note that KimbleCharting is offering a 2 week Free trial to See It Market readers. Just send me an email to services@kimblechartingsolutions.com for details to get set up.
Twitter: @KimbleCharting
Any opinions expressed herein are solely those of the author, and do not in any way represent the views or opinions of any other person or entity.


