Over the years, we have consistently pointed out the importance of stock market leadership.
The premise is simple. If a sector is out-performing, find strong stocks within that sector. If we are in a bull market, follow out-performing sectors (leaders) for clues about the stock market’s health.
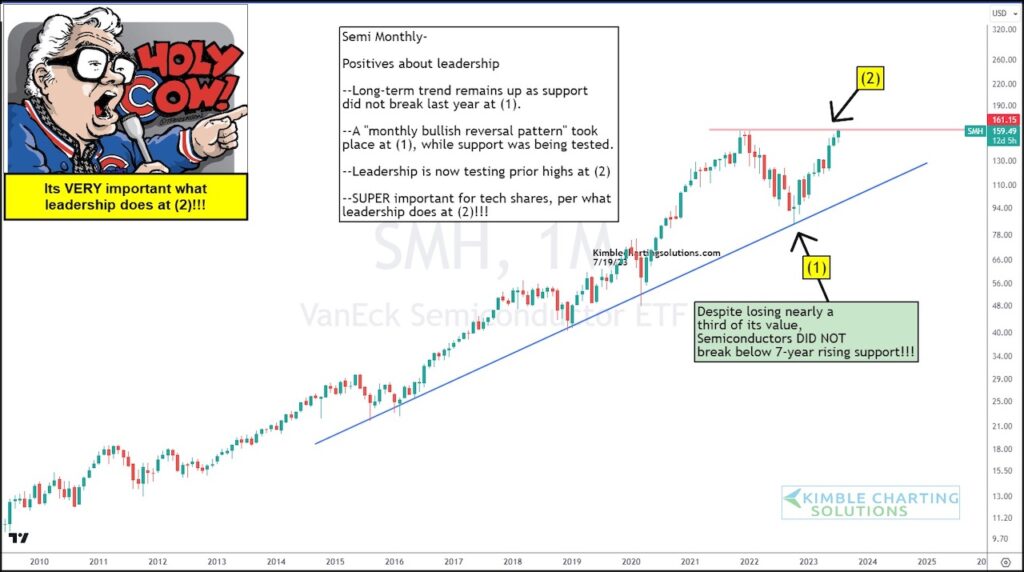
One such sector is the Semiconductors. Below is a “monthly” chart of the $SMH etf.
At first glance, we can see how the turn lower into 2022 lead the market lower and how the turn higher into 2023 has lead the market higher.
Note that the long-term trend is still higher as the blue trend line support at (1) held firm. Equally important, $SMH put in a bullish reversal off of that support which lead the Semiconductors (and the market) higher.
Currently, $SMH is testing its prior highs at (2). And ‘holy cow’, it sure looks important what this market leader does next! Stay tuned!!
$SMH Semiconductors “monthly” Chart
Note that KimbleCharting is offering a 2 week Free trial to See It Market readers. Just send me an email to services@kimblechartingsolutions.com for details to get set up.
Twitter: @KimbleCharting
Any opinions expressed herein are solely those of the author, and do not in any way represent the views or opinions of any other person or entity.


