Stocks have gone nowhere for 4 weeks.
And things should get interesting in the weeks ahead as the stock market cycle takes hold.
Market Summary:
The S&P 500 Index (INDEXSP:.INX) moved lower last week, declining by 0.2% for the second week in a row.
The House of Representatives affirmed a Republican tax plan on Thursday and stocks moved higher. But there is uncertainty about the final outcome, as the Senate gears up for its vote.
With a new short-term market cycle having started, the S&P 500 may move higher next week, but later we may be set for a breakdown as intermediate market cycles suggest a top.
The stock market again moved lower last week, with the S&P 500 (SPX) moving down 4 points to 2578.
On Monday, the British pound dropped as support grew for a no-confidence vote on Prime Minister Theresa May. Greater uncertainty led to a decline in the S&P 500 overnight, but stocks recovered during regular trading hours.
On Tuesday, copper prices moved lower as the Chinese government reported slowing factory output, investment, and retail sales. Later that day, the euro surged as the German government reported that the economy grew at 0.8% in Q3 versus 0.6% in Q2.
The S&P 500 moved lower and then higher on each piece of news. It then moved lower again as the US government reported stronger than expected rise in the Producer Price Index, which increased by 0.4% versus the 0.1% expected.
On Thursday, Asian markets rose, perhaps looking towards the possibility of an affirmative vote on the Republican tax plan in the US House of Representatives. As the US market opened, the government reported factory output in October of 1.3% versus the expectation of 0.6%, along with an upward revision for September.
The SPX surged and then topped later in the day as the House voted in favor of the tax plan. Stocks tailed off towards the end of the day, but the SPX finished up 21 points at 2585, or 0.8%. The NASDAQ (INDEXNASDAQ:.IXIC) was the big winner for the day, finishing up 81 points at 6339, or 1.3%.
On Friday, the government reported a 13% increase in housing starts, perhaps due to rebuilding in communities hit by hurricanes in previous months. However, markets fell as San Francisco Fed President John Williams opined that a December interest rate hike was likely.
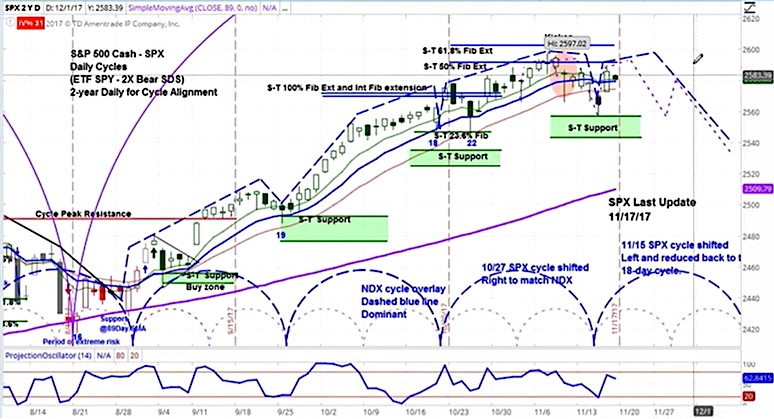
The SPX chart above shows our projection for this week: a move higher and then lower as the short-term cycle ends. Depending on how high it gets, this may be an indicator of a top in the stock market. If the stair step pattern that has been in place from the start of this intermediate cycle is broken, keep your eyes peeled for a move lower.
The blue-dotted half circles at the bottom of the chart illustrate the short-term cycle patterns. For more a more detailed look at cycle analysis for a broader selection of futures, watch the askSlim Market Week every Friday afternoon.
Here’s the latest askSlim Market Week:
Twitter: @askslim
Any opinions expressed herein are solely those of the author, and do not in any way represent the views or opinions of any other person or entity.


: Showing Some Signs of Emerging Strength")
