This year has definitely accelerated the trend in utilizing and technology in the way we work (remotely) and live.
And it’s showing up in the stock market.
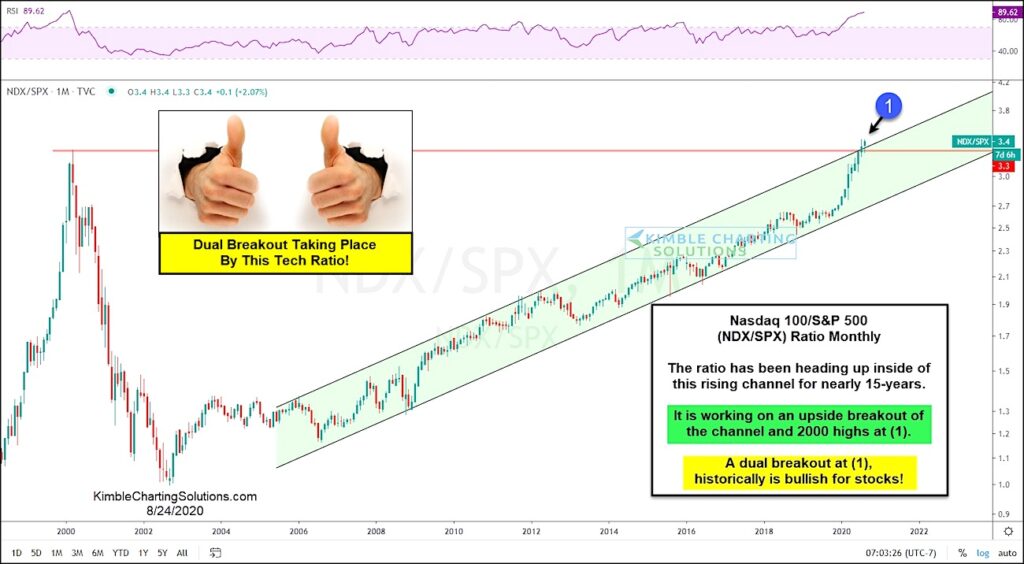
Today’s chart looks at the ratio of the Nasdaq 100 Index (large cap tech stocks) to the S&P 500 Index (broader based large cap stocks).
As you can see, the Nasdaq 100 has been out-performing the S&P 500 for the past 15 years, steadily rising within a bullish price channel.
This tech ratio is now working on a dual breakout attempt as it surpasses the 2000 highs AND breaks above its upper channel resistance at (1).
Large cap tech is the clear leader. And a successful breakout attempt at (1) would only further emphasize this important stock market trend.
Nasdaq 100 versus S&P 500 Performance Ratio “monthly” Chart
Note that KimbleCharting is offering a 2 week Free trial to See It Market readers. Just send me an email to services@kimblechartingsolutions.com for details to get set up.
Twitter: @KimbleCharting
Any opinions expressed herein are solely those of the author, and do not in any way represent the views or opinions of any other person or entity.


: Showing Some Signs of Emerging Strength")
