Several risk on indicators surged higher into year-end, such as small cap stocks and junk bonds.
And as we typically see, this coincided with a big year-end stock market rally.
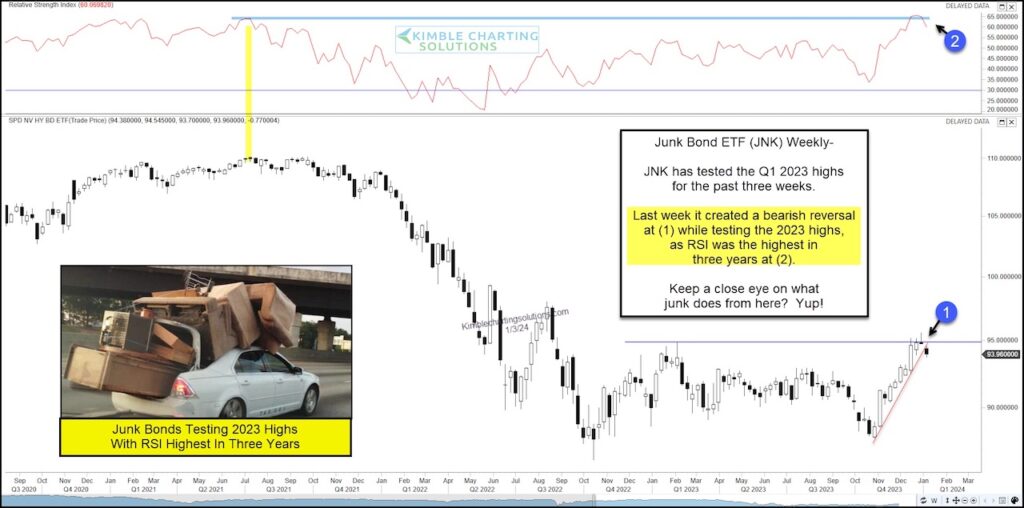
Today we take a look at the Junk Bonds ETF (JNK) to see if this is sustainable into Q1 of 2024.
Below is a weekly chart of the $JNK. As you can see, the Junk Bonds ETF has tested the Q1 2023 highs (resistance) for the past 3 weeks at (1). $JNK is also testing this important price level while its RSI is the highest in a few years at (2).
To sum it up, junk bonds are overbought and testing price resistance… and starting to slip a bit. Stock market bulls hope $JNK doesn’t continue lower. Stay tuned!
$JNK Junk Bonds ETF “weekly” Chart
Note that KimbleCharting is offering a 2 week Free trial to See It Market readers. Just send me an email to services@kimblechartingsolutions.com for details to get set up.
Twitter: @KimbleCharting
Any opinions expressed herein are solely those of the author, and do not in any way represent the views or opinions of any other person or entity.
: Creating Bullish Divergence?")


: Creating Bullish Divergence?")