The chart and data that follow highlight non-commercial commodity futures trading positions as of September 11, 2018. This data was released with the September 14, 2018 COT Report (Commitment of Traders).
Note that this chart also appeared on my blog.
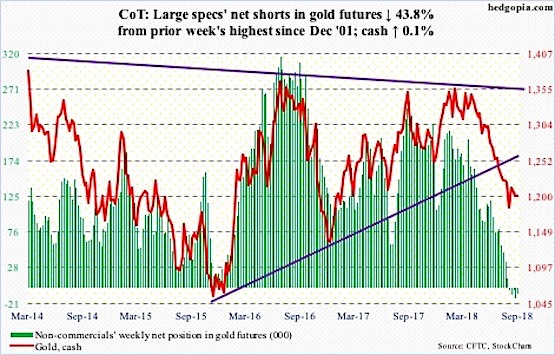
The chart below looks at non-commercial futures trading positions for Gold futures. For the week, Gold finished flat (closing up a point), with the Gold ETF (NYSEARCA:GLD) closing down -0.1%.
Here’s a look at Gold futures speculative positioning. Scroll further down for commentary and analysis.
Gold is attempting to bottom here – Gold bugs are looking for this consolidation to spring higher and take out key price resistance (see comments below).
Let’s look at the COT data and technical to see what’s next…
GOLD Futures: Currently net short 7.6k, down 5.9k.
Gold is down 0.5 percent in September. If this holds up, it would mark the 6th straight month of declines. The yellow metal is getting oversold… but oversold momentum indicators can be difficult to time.
Since hitting multi-month lows in mid-August, gold has sideways in a consolidation pattern. This will prove to be bullish should bulls take out support-turned-resistance of around $1,213. Gold rallied as high as $1,218 late last week but closed lower after rejected at the 50-day.
Fund flows are slightly negative, with SPDR gold ETF (GLD) losing $57 million in the week ending Wednesday. At the same time, this is an improvement over recent weekly outflows.
Twitter: @hedgopia
Author may hold a position in mentioned securities at the time of publication. Any opinions expressed herein are solely those of the author, and do not in any way represent the views or opinions of any other person or entity.


