Just as the economic recovery is picking up steam, there are mixed messages coming from inflation data as well as the equities (breadth) and bonds markets (yields).
Enter the commodities market… here we can find several key economic inputs that are elevated, and some that are testing major price inflection points.
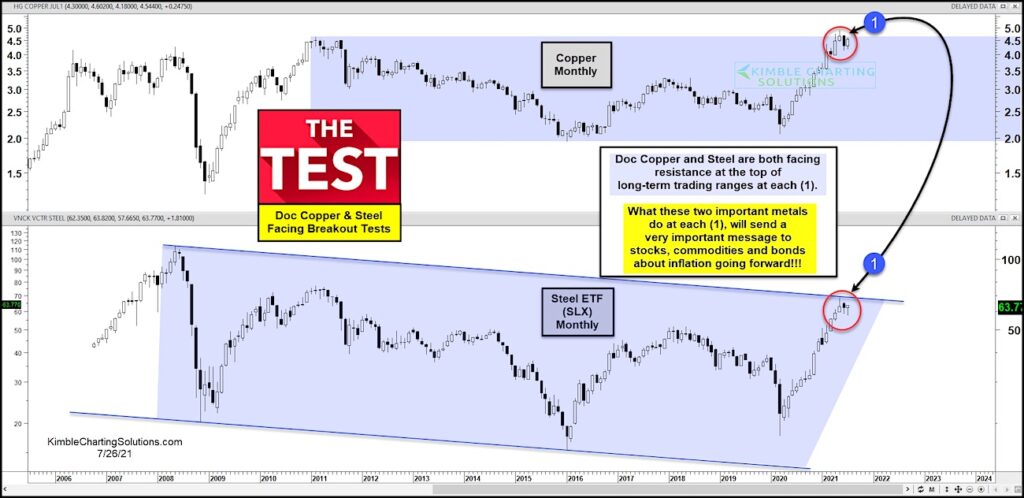
In today’s chart 2-pack, we look at Copper and Steel prices on a long-term “monthly” basis. Considering the importance of each, we refer to them as Doc Copper and Man of Steel!
Copper futures prices have been in a 10-year sideways price channel while the Steel ETF (SLX) has been in a 12-year declining trend channel. That said, both have rallied sharply to test long-term breakout resistance at each (1)… and at the same time!
Will Doc Copper and Man of Steel head lower or breakout to new highs? What happens next should send an important message to stocks, bonds, and commodities! It may also have ramifications for the economy and inflation! Stay tuned!
Copper Futures and Steel ETF “monthly” Charts
Note that KimbleCharting is offering a 2 week Free trial to See It Market readers. Just send me an email to services@kimblechartingsolutions.com for details to get set up.
Twitter: @KimbleCharting
Any opinions expressed herein are solely those of the author, and do not in any way represent the views or opinions of any other person or entity.
")


")
