Will investors follow seasonal trends and “sell in May”? One key sector to follow is the banking/financials sector, as it is a key S&P sector and economic indicator.
To this end, the Bank Index (BKX) offers a strong reflection of the health of this group.
The trend has been up for several weeks, but momentum is slowing. As we push through April, investors should watch BKX closely – any breakdown below its up-trend line or key MAs (moving averages) would be considered warnings.
Today’s daily and weekly charts highlight key price points to watch as April pushes toward May.
Note that the following MarketSmith charts are built with Investors Business Daily’s product suite.
I am an Investors Business Daily (IBD) partner and promote the use of their products. The entire platform offers a good mix of technical and fundamental data and education.
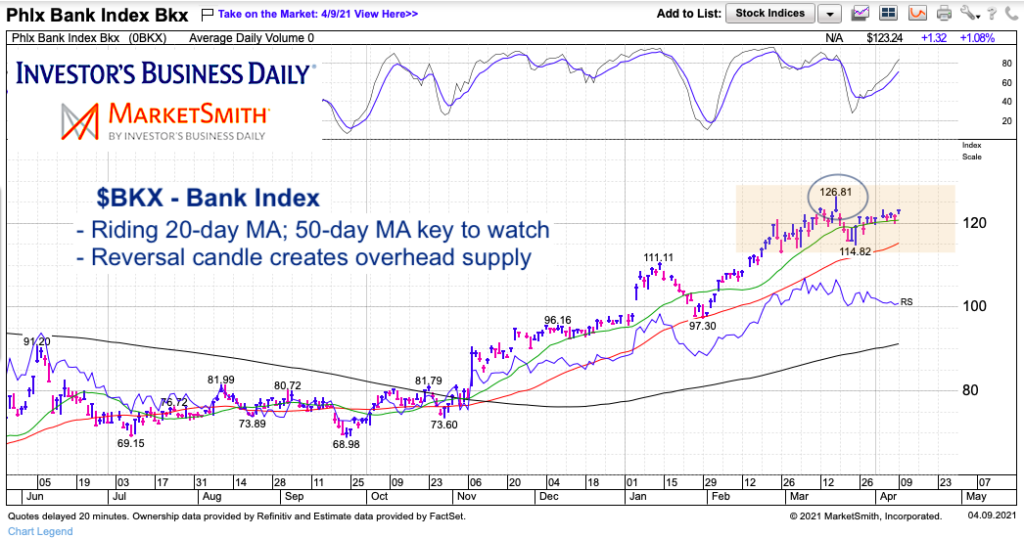
BKX Bank Index “daily” Chart
The biggest red flag on the “daily” chart is the price reversal that took place last month (circled). That reversal candlestick indicates overhead supply and could contain the Bank Index within a trading range (115-127) for April. Any move below the 20-day MA (green) would be concerning, but the big level to hold is the 50-day MA (red). Back to back closes below 115 would be concerning.
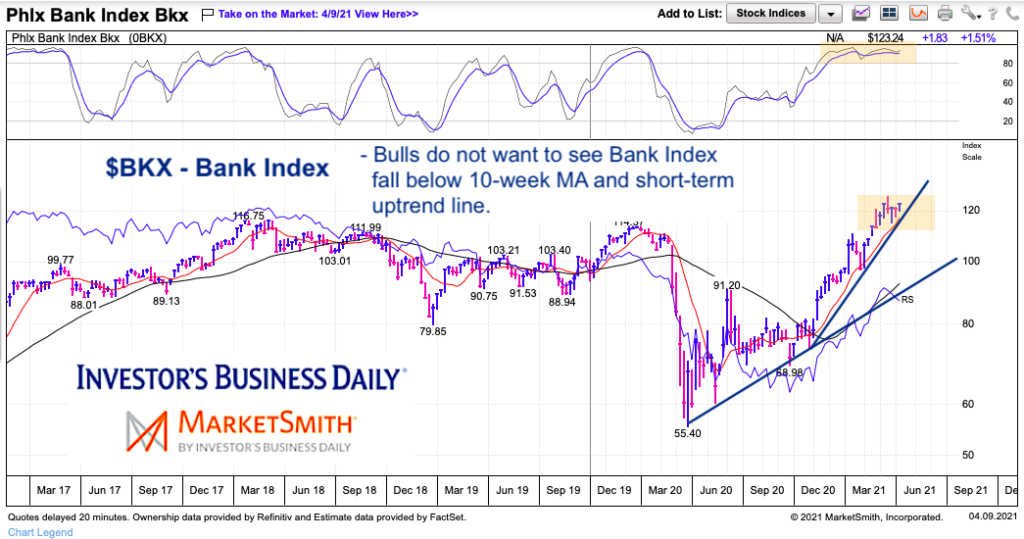
BKX Bank Index “weekly” Chart
The “weekly” chart highlights the steep uptrend line since the November breakout – that aligns with the 10-week MA (and 50-day MA). A weekly close below 115 could bring further selling.
Twitter: @andrewnyquist
The author may have a position in mentioned securities at the time of publication. Any opinions expressed herein are solely those of the author, and do not in any way represent the views or opinions of any other person or entity.
: Creating Bullish Divergence?")


: Creating Bullish Divergence?")