As many readers may know, I’ve been quite outspoken on Apple Inc. (NASDAQ:AAPL) for almost a year now. The conversation has never been directed at the “company” or its products which I happen to use. My view on AAPL has always been purely technical and more specifically related to it as a trend following stock (and the AAPL 40 week moving average).
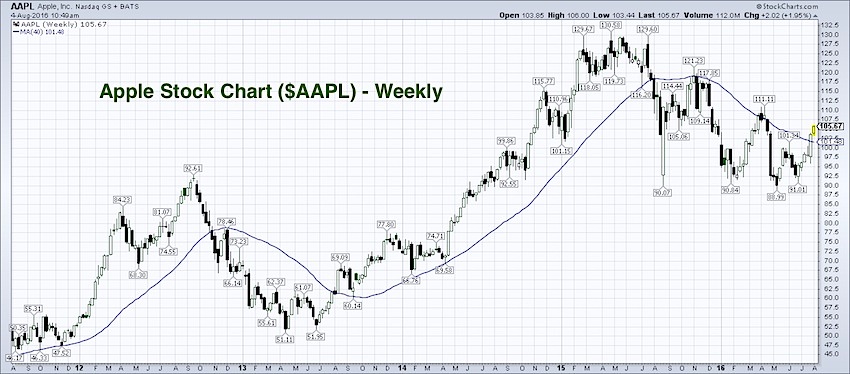
In my opinion, Apple’s stock chart over the last five years has been a textbook example of trend following. What I mean is that anyone with an intermediate to longer term time horizon has been handsomely rewarded being long the stock above the AAPL 40 week moving average. And, alternatively, short or no position when the stock is trading below the AAPL 40 week moving average.
From late last year: Is It Time To Take A Bite Of Then Apple?
Trend following is one of the many tools that I use when wearing my technicians hat. Trend following is by no means a panacea, but when investing or trading there simply isn’t any sure fire strategy for batting 100.
This isn’t to say that there aren’t great strategies or systems for trading, but some are better than others. And some fit the investor better than others. What I suggest is study, read and seek out styles that fit your personality.
As for a conclusion, Apple’s stock price is back above its 40 week moving average. This is a promising sign for bulls and those that want to take a closer look at the stock. Keep an eye on that moving average.
Thanks for reading.
Twitter: @Snyder_Karl
The author does not have a position in mentioned securities at the time of publication. Any opinions expressed herein are solely those of the author, and do not in any way represent the views or opinions of any other person or entity.


