Many investors continue to follow or own positions in Apple stock (AAPL). After all, it is a visible part of investors 9-5 as well as their everyday daily lives. In short, it’s a tech behemoth.
As a trader, I like to look across multiple timeframes and highlight key levels. Looking at Apple, I can do this using AAPL price pivots to expose opportunities within those timeframes, be it daily, weekly, or monthly charts.
Here’s a quick update on what we’re seeing:
1). AAPL is stalling out at the yearly(P) AAPL price pivot. I have highlighted this pivot several times on Twitter. I feel the high for this year could potentially be in. This level will likely decide that.
2). A failure at the Yearly(P) AAPL price pivot would open the door for a possible fall this spring to the YearlyS1 pivot at $86. In 2013 Apple stock price failed at the Yearly(P) AAPL price pivot at $555 and then fell to $388.
Apple Stock Chart w/ Yearly Price Pivots
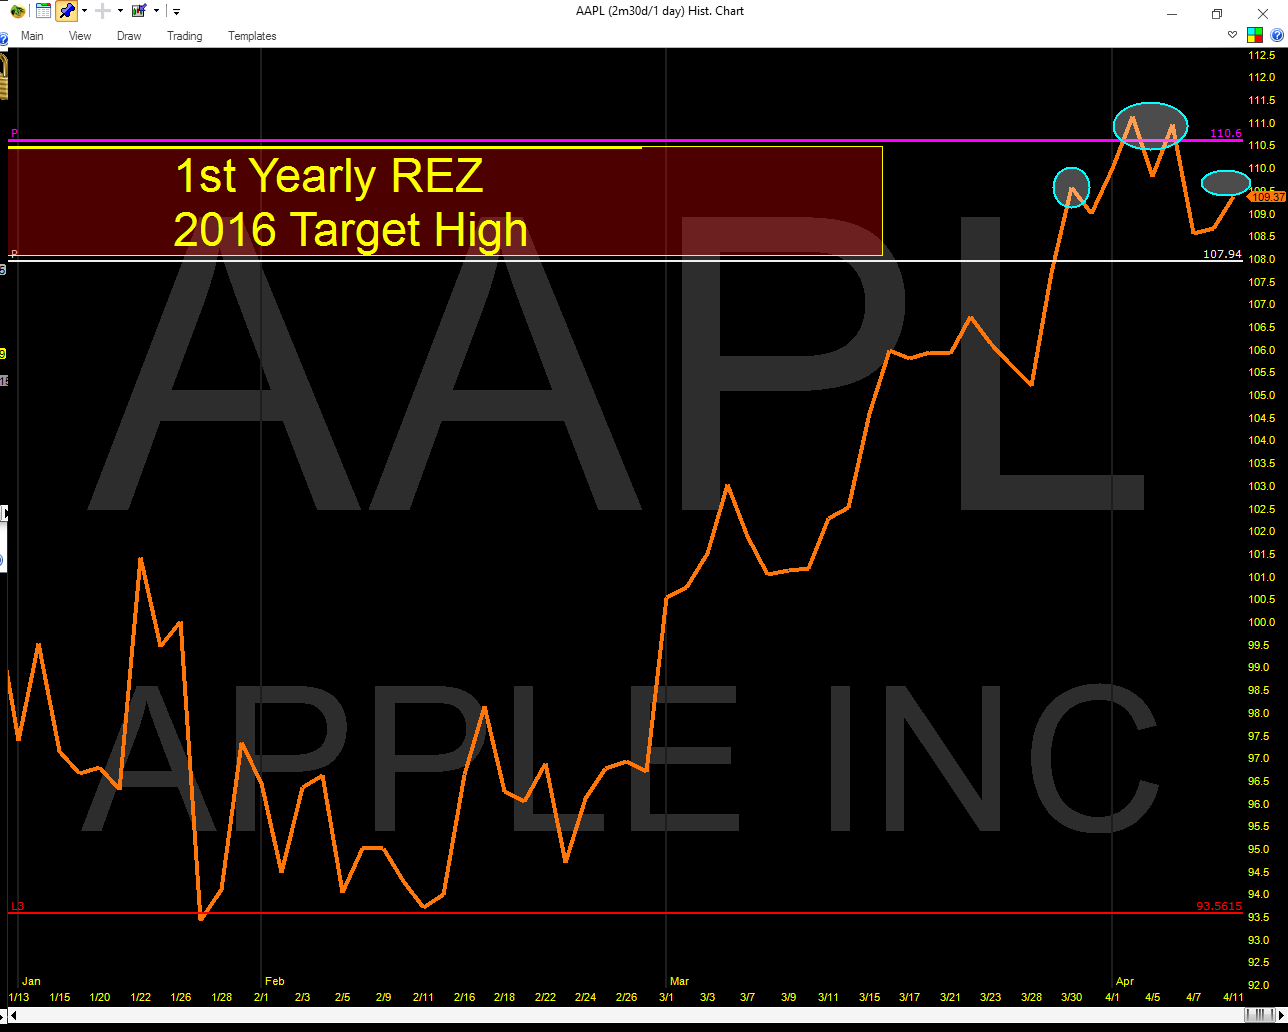
Earnings this quarter could drop 25-30% over last quarters. Perhaps that the catalyst for the decline I foresee. Only a strong breakout above the yearly pivot would alter this.
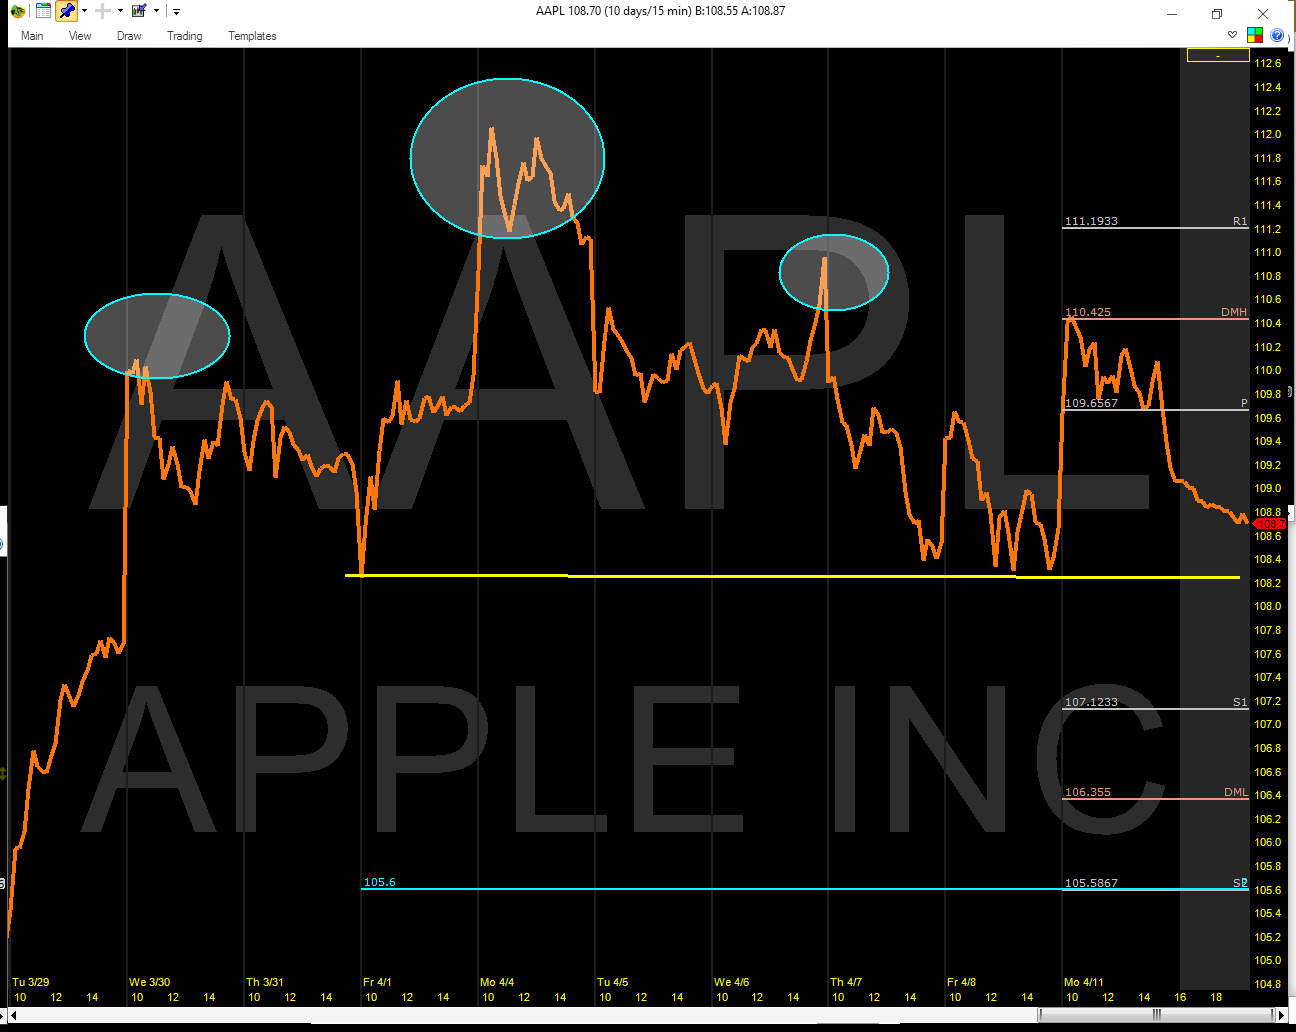
Lastly, here is an intraday zoom chart with AAPL price pivots. I would say that there is an 80% chance the Monthly(P) @ $105.68 will get tested in April.
Thanks for reading and have a great week.
Twitter: @Pivotal_Pivots
The author does not have a position in the mentioned securities at the time of publication. Any opinions expressed herein are solely those of the author, and do not in any way represent the views or opinions of any other person or entity.


: Showing Some Signs of Emerging Strength")
