Apple (AAPL) is all over the news right now, dominating the financial headlines – and rightly so. We’ve blogged about Apple before and highlighted how the 130-135 area was the potential top for a while.
Here’s a recap of past blogs:
- Here’s my post from February about Apple’s stock nearing a major wave completion. It highlights the above mentioned price resistance targets.
- Here’s another post about the importance of Apple’s Log trend line.
- And finally, here’s Andy Nyquist’s post highlighting Apple’s decline and test of the trend line on Monday.
Okay, so let’s pull this all together and see where Apple is at now… to the AAPL chart:
Apple Long-Term LOG chart – LOGS are key. Long term LOG charts and their corresponding trend lines give one a feel for rates of change. And when they break, it’s the first indication of a major change in trend. Watch this weeks close VERY closely. Thus far, this trend line has worked for 12 years on the world’s favorite stock.
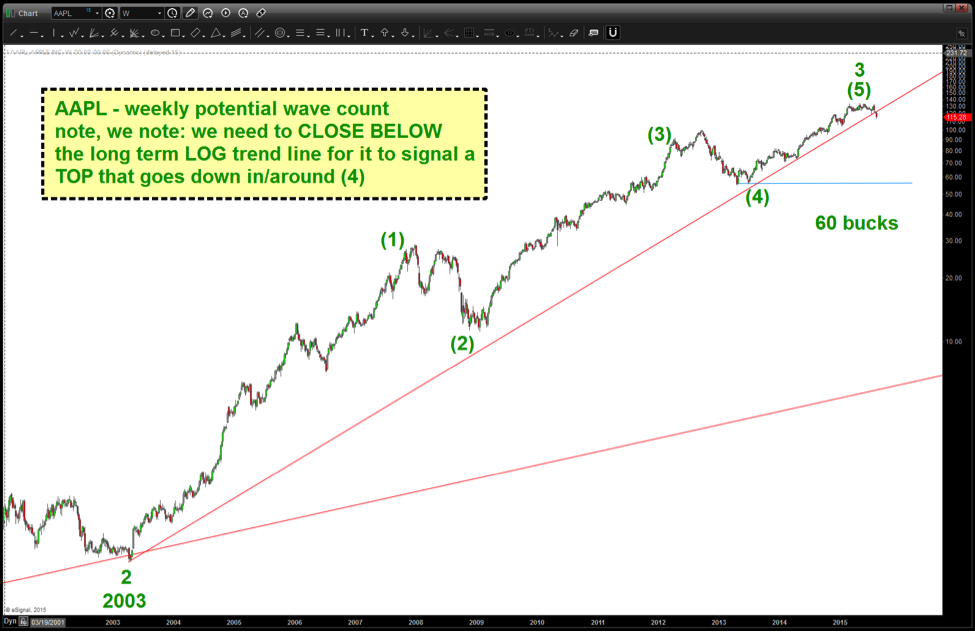
On the AAPL weekly chart, we can try to quantify the consequences of a trend break by using measured move targeting and Elliott wave. This gives us targets of 85-90 or as low as 60. Note that corrections tend to correct back to wave 4 of a lesser degree (see chart above).
I’m seeing this year’s highs as a wave 3 top. So that would make the current move the start of a wave 4 correction. Ultimately, this will prove VERY BULLISH for Apple’s stock. And we’ll likely look at buying AAPL in/around 134 days from now.
Thanks for reading.
Twitter: @BartsCharts
Author does not have a position in mentioned securities at the time of publication. Any opinions expressed herein are solely those of the author, and do not in any way represent the views or opinions of any other person or entity.


: Showing Some Signs of Emerging Strength")
