Back in February, I posted that a major wave was nearing completion on Apple stock (AAPL). This was all about price action (wave patterns) and mathematics (Fibonacci relationships). It likely wasn’t very popular at the time – after all, Apple (AAPL) is an incredible company and the shares were on a tear at the time. Here’s an excerpt from that post:
Shares of Apple Inc. (AAPL) have been very strong of late. And Apple is undoubtedly a great company. But I have to ask one simple question: Am I the only one that can see the current wave pattern for Apple’s stock? The latest major wave higher may be coming to an end and I would like to discuss some potential AAPL price targets.
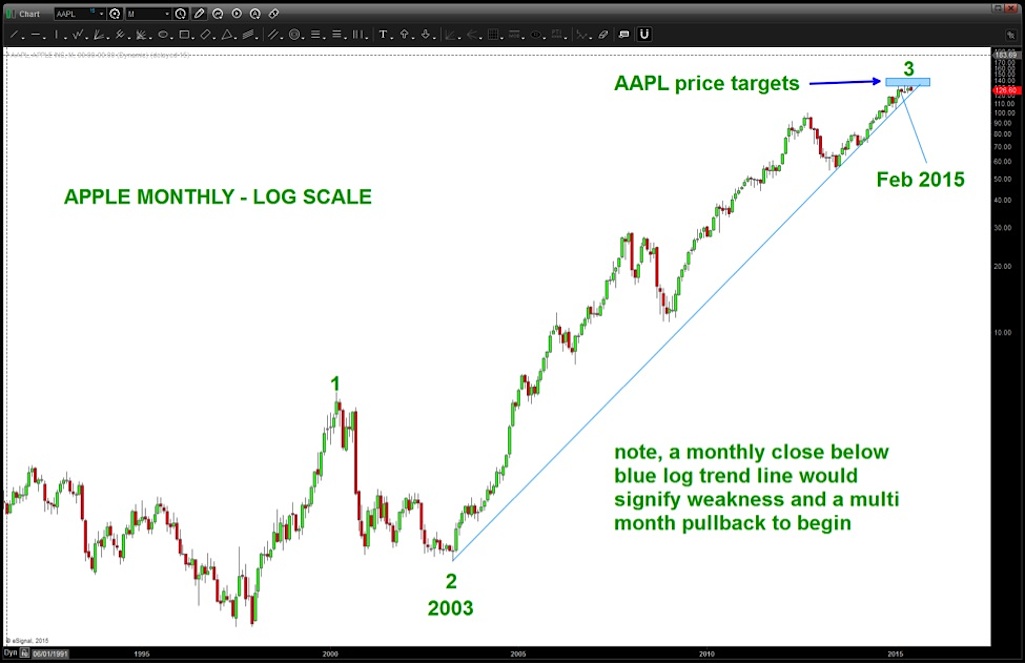
The target price zone has been hit and Apple (AAPL) has spent a lot of time consolidating in a sideways move within 10 to 12 dollar of its highs. Using a long-term (12 year) log trend line we can see that critical trend support is just below current levels. This needs to be held for a continuation of this bull trend.
A monthly close below its log trend line – roughly the 122-123 level – would likely spell trouble for the Apple stock bulls. Note that 122 also aligns with the March pullback lows.
If AAPL heads higher (and it can) there are still targets in the 135-140 range. Check out my prior post for more on my math and wave counts. Either way, I think it’s time to be cautious with Apple stock (AAPL).
Apple (AAPL) Monthly Chart
As always, thanks for reading. And rock on, okay?
Twitter: @BartsCharts
No position in any of the mentioned securities at the time of publication. Any opinions expressed herein are solely those of the author, and do not in any way represent the views or opinions of any other person or entity.

: Showing Some Signs of Emerging Strength")
