 For the past two years or so, investors have had it pretty easy with Apple (AAPL). There have been a few scares, but mostly sunny skies. But the recent decline in shares has fallen below a key technical price indicator and is nearing an important juncture in time and price. In sum, if AAPL doesn’t find its footing soon, it may risk a deeper drop.
After years of active investing, you realize that Mr. Market can humble you pretty quick. That’s not to say that Apple is doomed, it’s more of a truism for why we all should have a plan for our investments. The price set on any asset has plenty to do with fundamentals, but the price is what it is… and an open market of fellow investors and institutions sets that price. That is why follow price ahead of any other indicator out there.
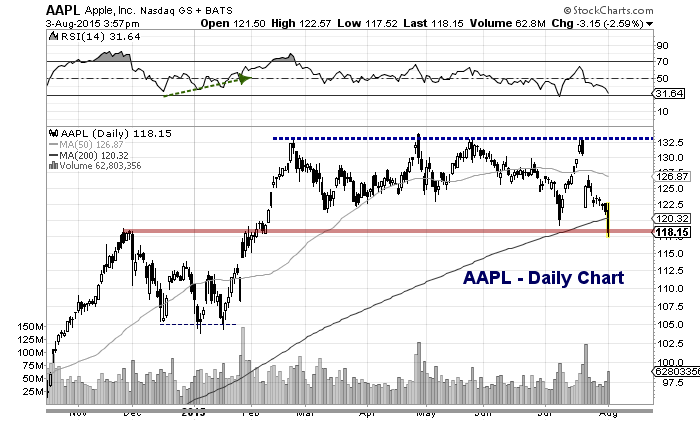
Right now, the market has set the price of Apple stock at around $118 per share.
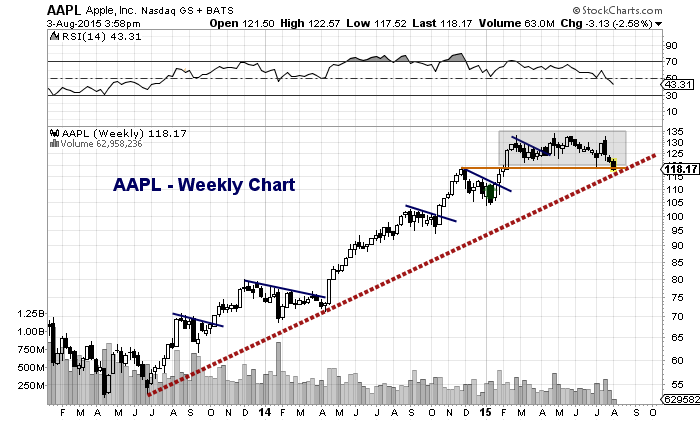
To recap, Apple stock has broken its 200 day moving average (see daily chart) and is currently testing its uptrend line from the 2013 lows (see weekly chart). The current level also marks the November 2014 highs.
A move lower would likely target the open gap from the late january earnings “beat”. But a pivot higher in the $115-$118 zone (give it a little wiggle room) would neutralize the selling pressure and give bulls a chance to regroup.
Apple (AAPL) Daily Chart
Apple (AAPL) Weekly Chart
Thanks for reading and trade safe.
Twitter: @andrewnyquist
The author does not have a position in any of the mentioned securities at the time of publication. Any opinions expressed herein are solely those of the author, and do not in any way represent the views or opinions of any other person or entity.


 and Semiconductors (SMH): Concerning Price Pattern?")


