The last time Apple, Inc. ($AAPL) had a sales slow down was in 2013. Well, if Apple’s earnings report is any indication, it may be 2013 all over again. And that could spur a deeper decline in Apple’s stock price and bring lower AAPL price targets into view.
Make no mistake, Apple is incredibly profitable and a great company. But when you are an investor, it’s the price action that matters.
And Apple has been signaling that something is amiss for a while – see my post on Apple’s bearish head and shoulders price pattern from mid-November.
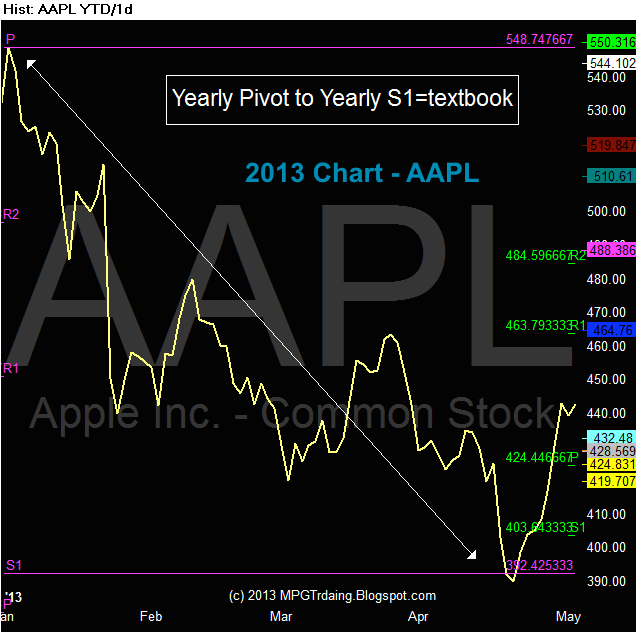
In drawing a comparison to 2013, I’m solely looking at the price patterning. In 2013 Apple’s stock price fell down to the Yearly S1 pivot point at $392 before bottoming. You can see this in the Apple stock chart from 2013 below.
Apple Stock Chart ($AAPL) – 2013
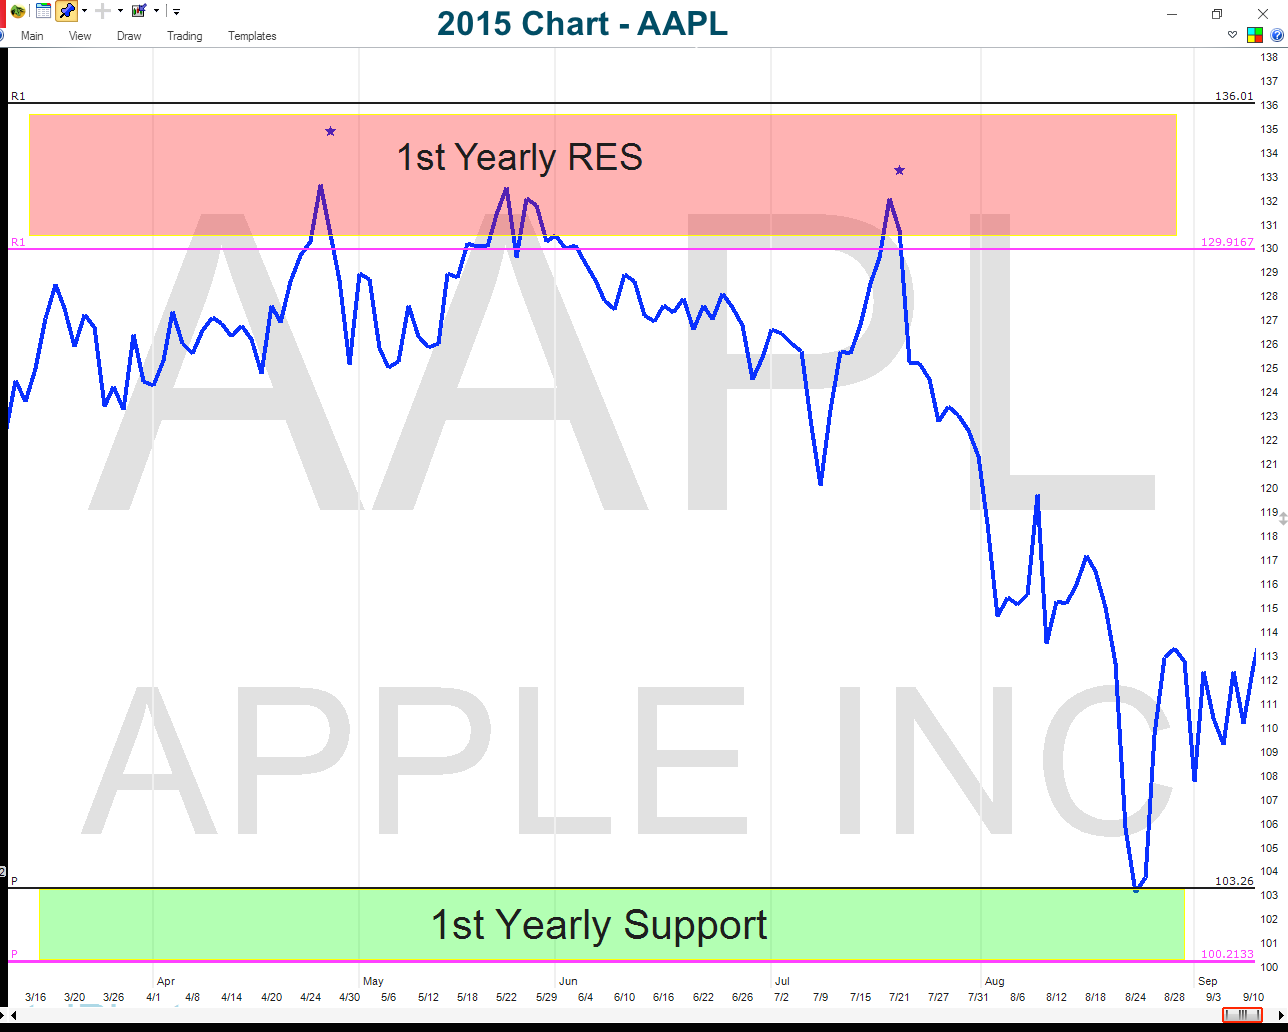
In 2015, the Yearly R1 pivot points held AAPL in check and proved to be the high for the year. See chart below.
Apple Stock Chart ($AAPL) – 2015
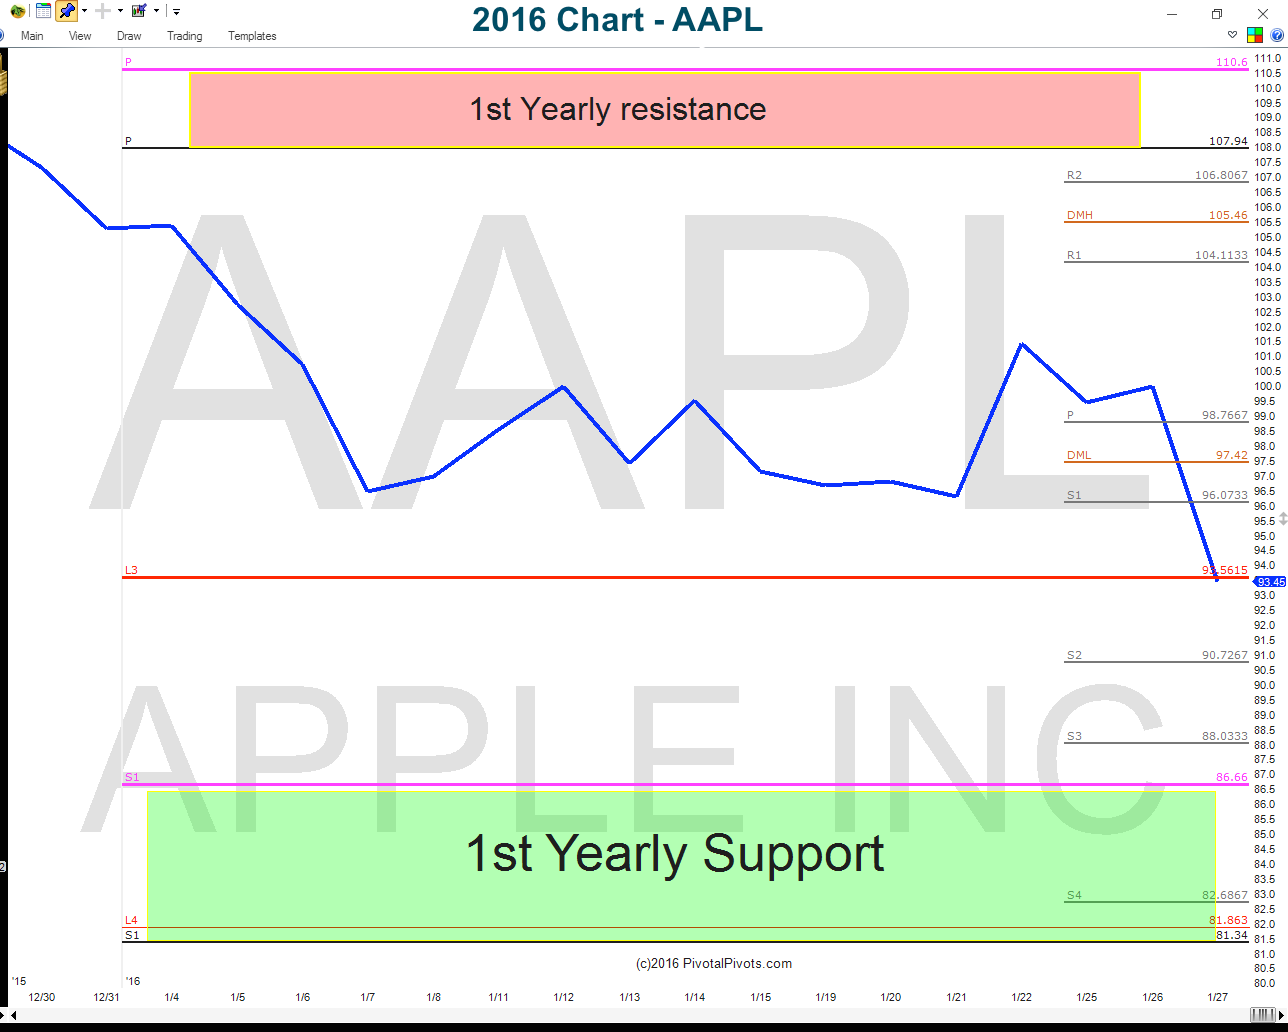
If Apple’s stock price follows 2013, the 2016 Yearly S1 support pivot points are at @ $86 & $81. That is where I see longer term buying opportunities at. Both seem like respectable AAPL price targets from current levels. See chart below.
Apple Stock Chart ($AAPL) – 2016
I received a lot of hate mail in November when I warned investors that lower prices where coming. Fundamentals don’t show you where to buy & sell. But the price action and pivots do!
Learn more about my Pivotal Pivots methodology at my site PivotalPivots. Thanks for reading.
Twitter: @Pivotal_Pivots
The author does not have a position in the mentioned securities at the time of publication. Any opinions expressed herein are solely those of the author, and do not in any way represent the views or opinions of any other person or entity.


