By the time you read this, the buzz of what the Federal Reserve did and Chairman Powell’s presser will be over, at least for the day.
We will not repeat the obvious.
What we are focused on is the underlying reasons that the Federal Reserve, unless they are willing to goose rates to over 8%, will have little impact on the:
A) Upcoming Commodities Super-Cycle and
B) The unique undefinable labor market which is already leading to demand for higher wages and employers forced to keep the staff they already have. In other words:
C) Yet another indication of the continued robustness of the labor market and dilemma for the FED.
JOLTS: Useless indicator or Harbinger of More Inflation?
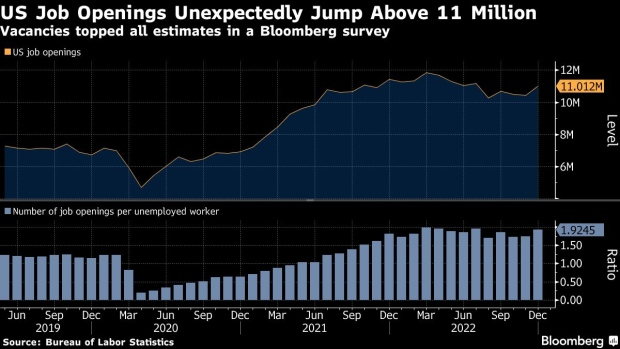
The Job Openings and Labor Turnover Survey (JOLTS) program produces data on job openings, hires, and separations.
Here is the part we find most fascinating and most difficult for the Central Bank to reconcile.
The largest increase in job openings is in the services area-hotels and restaurants. 1.74 million positions have been posted. Plus, in the UK and in France, workers are striking. They do not want to work for pay raises of 3% when inflation is at 10%.
Then, add that many companies are posting huge profits and stock buybacks (although by half of what that has been over the last decade.).
How far can people be pushed?
What the JOLTS report tells us is that regardless of the Fed and ECBs fight against inflation while trying not to spiral economies into recession, there is a bigger battle.
Social upheaval, rising food prices, wages not keeping up. With JOLTS up, corporate layoffs continue. FedEx as the latest example.
Sounds pretty inflationary, no?
Regardless, we will continue to watch what our market indicators (Big View) tell us about market breadth. We are particularly interested in the dollar (collapsing) and the performance of gold (cleared $1950).
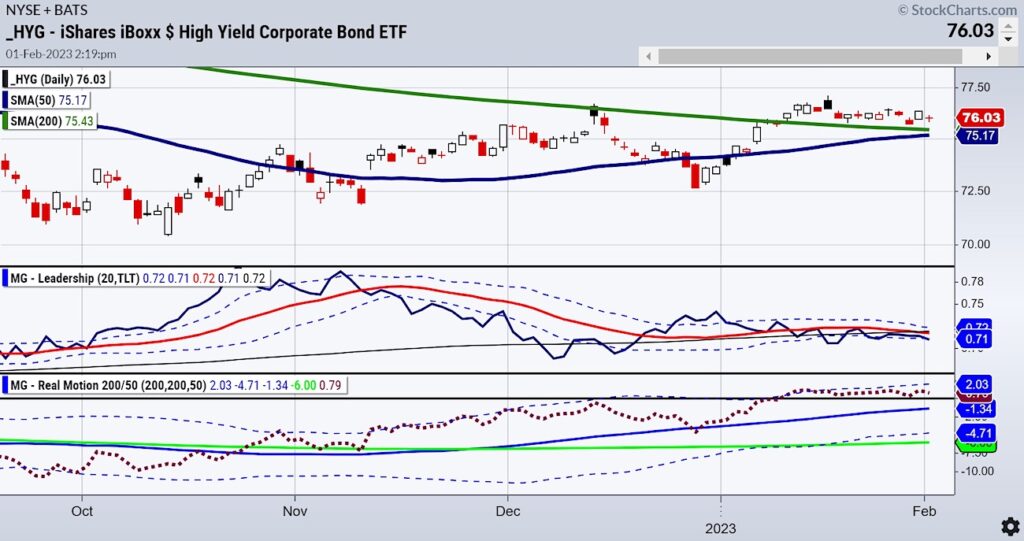
We also have keen eyes on the ratio between the high yield bonds and long bonds-now flashing more of a risk off scenario in spite of the recent rally in the indices.
Mish in the Media
CMC Markets-Trading the Tech Heavy Earnings Reports 02-01-23
Chuck Jaffee Money Life 01-31-23 (after minute 27)
Stock Market ETFs Trading Analysis & Summary:
S&P 500 (SPY) Still looking for the December highs 410.49 to clear with target 420.
Russell 2000 (IWM) 190 is now price support and 202 major resistance.
Dow (DIA) 343.50 is price resistance and the 6-mont calendar range high.
Nasdaq (QQQ) 300 is now a pivotal area.
Regional banks (KRE) 64.00 is price resistance.
Semiconductors (SMH) Havent written Sister Semi’s on a tear for awhile.
Transportation (IYT) Also strong so these are good signs-234.74 Dec highs to hold.
Biotechnology (IBB) Multiple timeframes count and this has failed the 23 month MA so far.
Retail (XRT) If you love the modern family then clearly they point to a happy time unless the inverted yield curve troubles them soon. 69 support 72 pivotal.
Twitter: @marketminute
The author may have a position in mentioned securities at the time of publication. Any opinions expressed herein are solely those of the author and do not represent the views or opinions of any other person or entity.


: Creating Bullish Divergence?")