October wasn’t a good month for tech stocks.
Especially for large cap momentum names traders had come to love… Alphabet / Google (GOOGL), Amazon (AMZN), Netflix (NFLX), Facebook (FB), and the list goes on.
For the month, the Nasdaq 100 fell 8.7%. Ouch.
Today we’ll look at GOOGL’s recent stock decline, and why the setup on GOOGL is textbook.
How you play it depends on the type of trader you are… and what timeframe lens you view it through.
Before I discuss the daily and weekly charts for Alphabet (GOOGL), I want to share a tweet of mine from October 29th.
Note that the charts below were built with Investors Business Daily’s product suite. I am an Investors Business Daily (IBD) partner and promote the use of their products – you can gain access here. It’s a great platform if you like a mix of technical and fundamental data.
$GOOGL Alphabet tests big round $1000 breakout level. #IBDpartner
Weekly buy setup suggest bounce soon. But structure weakening. @MarketSmith charting here –> https://t.co/zm4F25Sd39 pic.twitter.com/E5UEUYHFu7
— Andy Nyquist (@andrewnyquist) October 30, 2018
As you can see, GOOGL touched down as low as 1007.20 before closing at 1034.73 on October 29. Just look at that support near the $1000 area.
Okay, fast forward a couple days, and Alphabet / Google bounced up over $1100 before settling at $1090.58 on Wednesday. Let’s look at the daily and weekly charts.
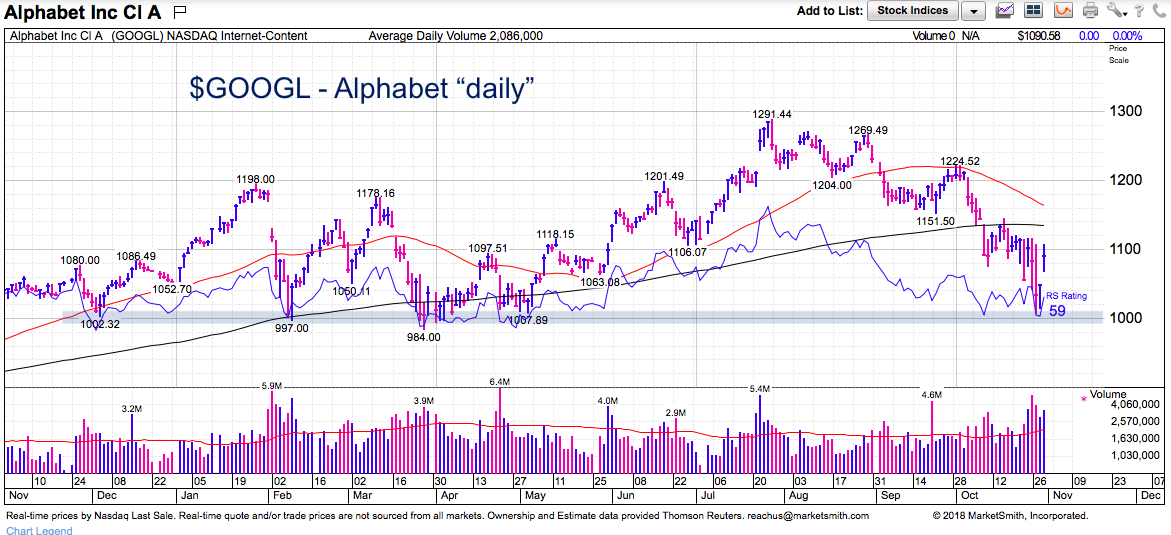
GOOGL Daily Chart
If we look at the daily chart, we can see just how textbook that bounce is. The $1000 level represents the lows from late 2017, February, March, and April. It was (and is) a clear “stop” out area for potential longs.
The stock has popped over the past 2 days and is likely to meet layered resistance up to its 200 day moving average and falling 50 day moving average. If the bounce lasts for more than a few weeks, pattern watchers will be eyeing a potential right shoulder (of a larger head and shoulders). That comes in around $1170-$1185.
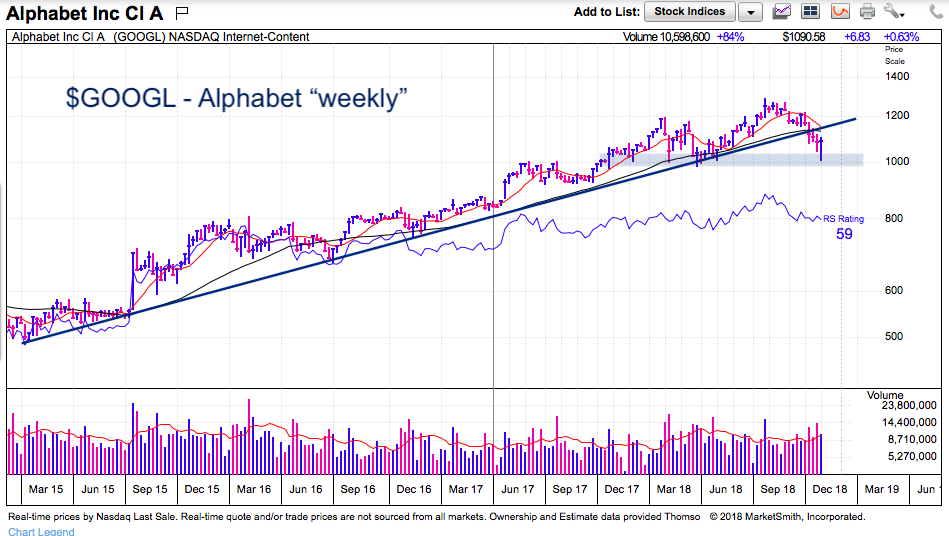
GOOGL Weekly Chart
The weekly chart also shows the importance of the $1000 price area. But it also shows a broken trend line. Everything turned “south” when this occurred – including the 10 week moving average (which confirmed the turn lower in the 50 day moving average).
That said this ascent is likely to slow and take some time to develop (if it continues). An eventual backtest of the broken trend line would be textbook. Then it would either decide to move lower once more, or breakout of the consolidation.
Twitter: @andrewnyquist
The author does not have a position in mentioned securities at the time of publication. Any opinions expressed herein are solely those of the author, and do not in any way represent the views or opinions of any other person or entity.


 Ready To Break Out?")