Well, Amazon (NASDAQ:AMZN) did hit my target price zone and fall back… but it certainly did NOT continue lower. Here’s my last update.
Instead, Amazon’s stock price reversed higher and zoomed to new all-time highs.
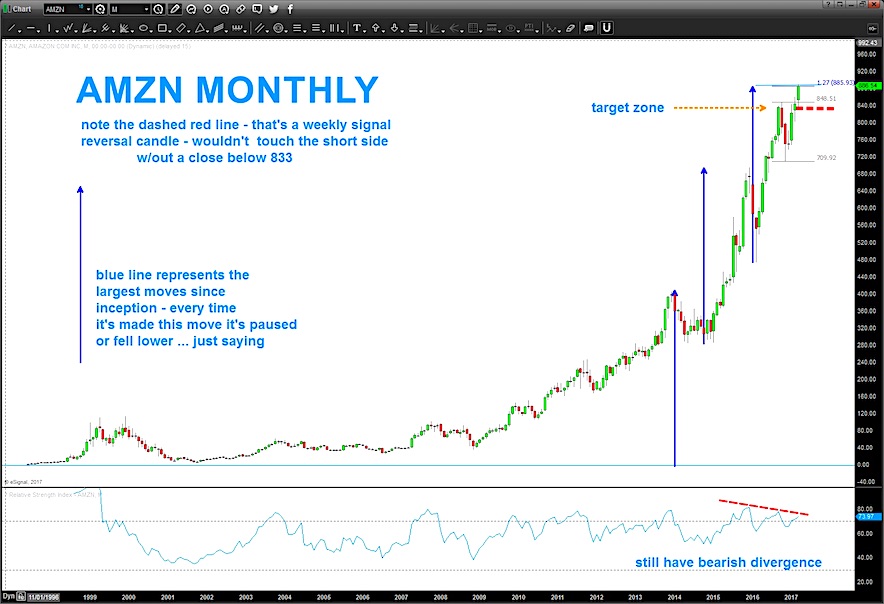
So, it’s all probability folks. And, quite frankly, I love Amazon (AMZN). What an amazing company and I use them all the time. It’s simply incredible… but if I took the ‘symbol AMZN’ off the chart it would still show the monthly measured moves (blue arrow), the bearish divergence on the 14 period RSI and the SRC (Signal Reversal Candle) level of 833.
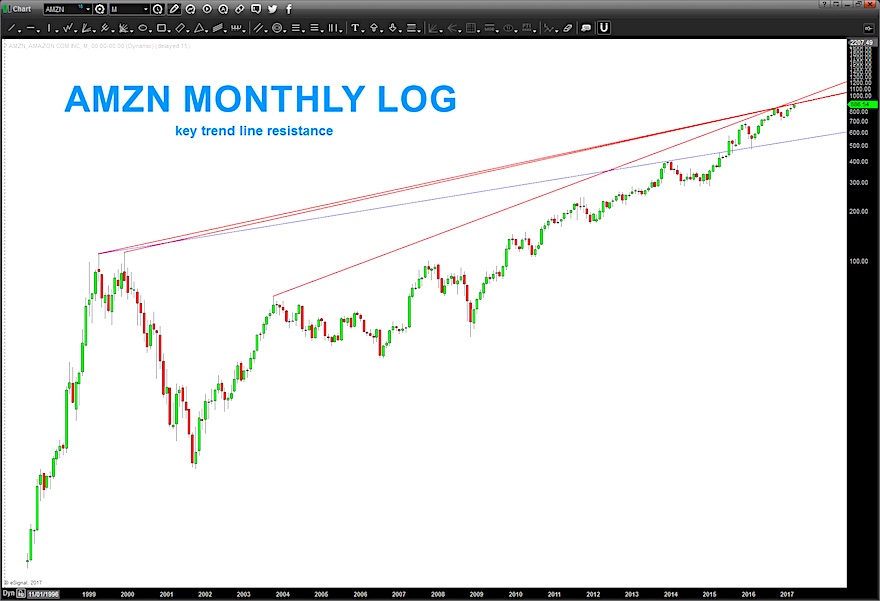
As you know, I enjoy LONG TERM LOG trend lines… this key resistance is appearing once more and may be formidable.
In order to make sure you understand the SRC is a lower risk signal. In this case, the short side is entered ONLY IF the “low” of the “high” candle is taken out on the close. That level is 833. A new candle appears on April 03, 2017 so if it continues to make new highs then that candle will be the basis for the SRC. So, in the coming week, make sure to keep an eye on Amazon’s stock price this week (AMZN).
Thanks for reading.
Twitter: @BartsCharts
Author does not have a position in mentioned securities at the time of publication. Any opinions expressed herein are solely those of the author, and do not in any way represent the views or opinions of any other person or entity.


