In August of 2016, shares of Amazon (NASDAQ:AMZN) were zooming higher. Investors were feeling giddy and it was apparent that I needed to do some chart pattern analysis for traders
So on August 8th I wrote a post about Amazon’s rally prospects. And more importantly, I highlighted some price targets for a potential top. In reality, that post served more as an effort to highlight zones for profit taking… call it a warning of sorts about an Amazon stock top.
Shares of Amazon (AMZN) moved roughly 1.5% above my price target area and promptly fell 16 percent.
That decline has been followed by a bounce higher. So, is Amazon’s stock price set to begin another powerful advance higher? Or is there further downside ahead? Let’s turn to the chart…
If you go back and review my August post, you’ll see that we had a lot of technical factors coming into play with regard to the upside ‘target zone’. And this could hint at more downside ahead.
Trust me, I realize that some hate mail and negative comments will come my way when I warn of another leg down for AMZN… but it’s about what you SEE and not what you believe.
Here’s what I see on Amazon’s stock chart:
- A pretty clear 5 waves down.
- Note, trying to keep it simple (for me) let’s look at these 5 waves down.
- Does 2 overlap 1? Nope.
- Is 3 the shortest wave? Nope.
- Does 4 overlap into where 1 ends? Nope.
- Folks, that’s a valid count. So when we have 5 waves that move against the overall trend, it USUALLY signals that after a move back in the direction of the original trend (in this case a move up) we are going to have another leg down
- Also note, based on the August blog, the ‘normal’ (believe it or not) correction in this AMZN move is right around 32 percent. We corrected ½ of that …
- The move up ‘should’ be in 3 waves labeled a-b-c.
- It is.
- Note how the ‘a’ wave equals the ‘c’ wave (or in the pattern recognition world AB=CD)
- Note, the PATTERN completes right at the .786 and 1.4142 extension (square root of 2)
- Also note, and this is important, the SQUARE ROOT target is EXACTLY the high and the completion of the pattern.
- Note, trying to keep it simple (for me) let’s look at these 5 waves down.
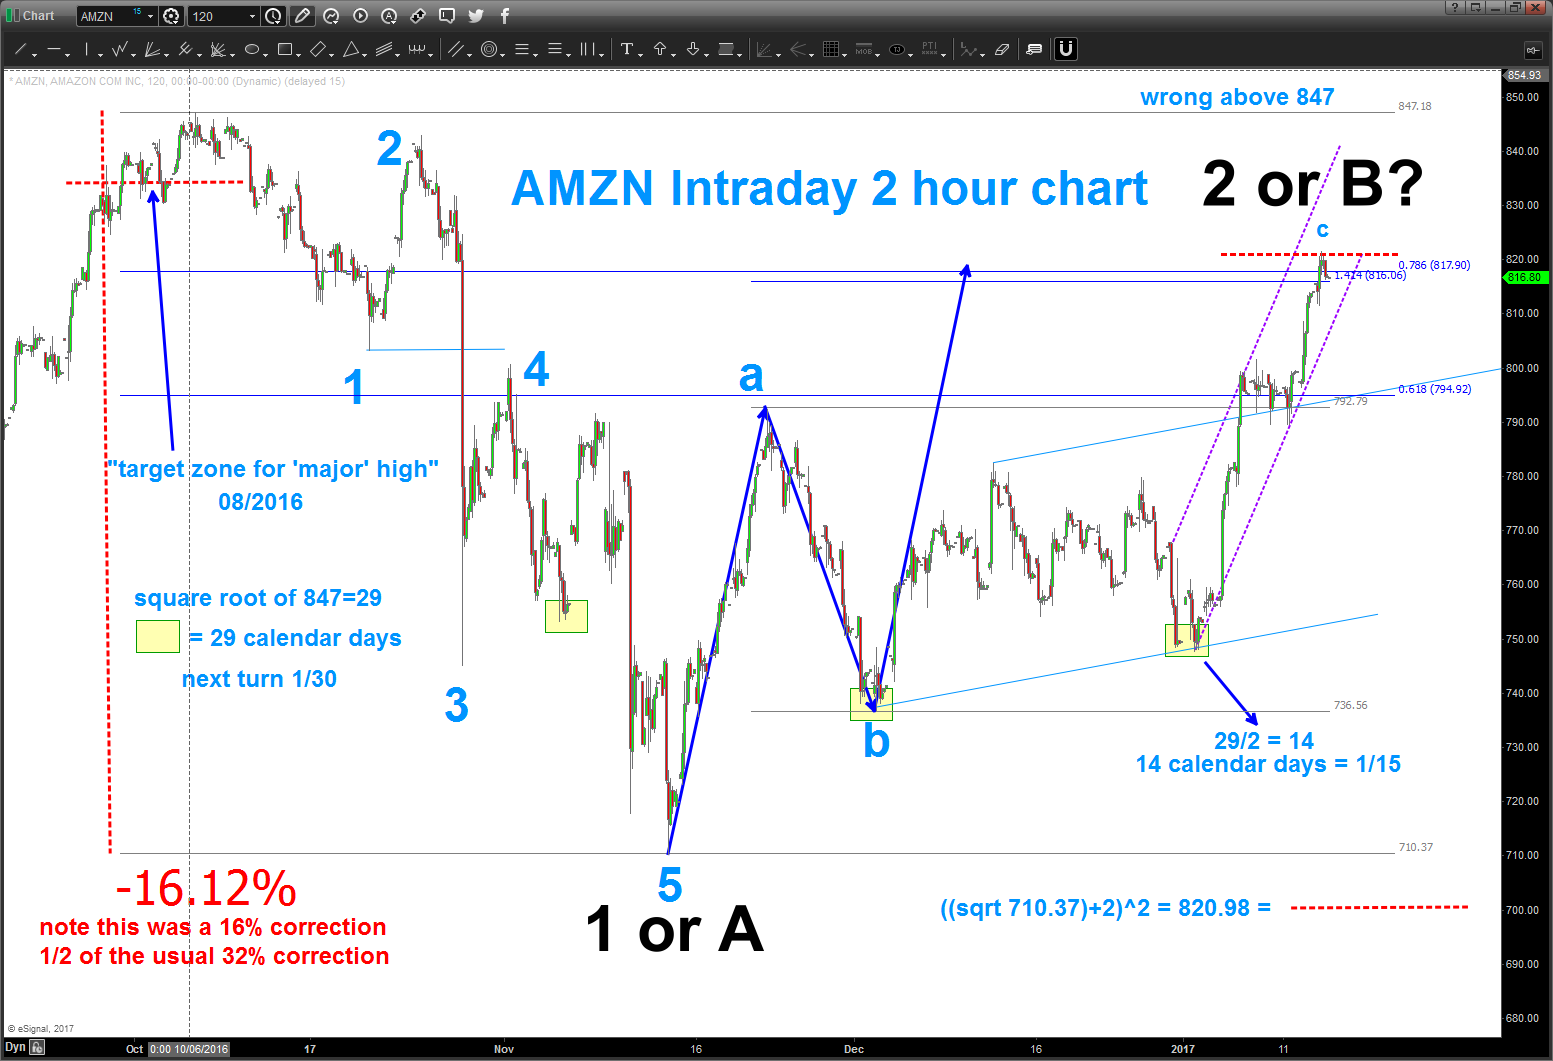
So if we get a nice break back below 810 (or better 800), then Amazon (AMZN) could really sell off. At that point we’d also have confirmation of Amazon stock topping (at $847).
Note that aything above the square root target will hint that this analysis is wrong. And any move above the old high at 847 will definitely mean this is wrong.
With regard to 847, if you take the square root you’ll find its equal to 29. Note the yellow boxes where 29 calendar days provided nice trade opportunities. Also, if we take ½ of 29 and we add to the current 29 day cycle shown it comes on Monday. So again, just trying to manage the risk.
Thanks for reading.
Twitter: @BartsCharts
Author does not have a position in mentioned securities at the time of publication. Any opinions expressed herein are solely those of the author, and do not in any way represent the views or opinions of any other person or entity.


