To be clear, Amazon (NASDAQ:AMZN) has been a top stock for several years. It’s in a bull market uptrend and that remains in tact.
BUT, caution is advised over the near to intermediate term after a nasty bearish price reversal last month (and into last week).
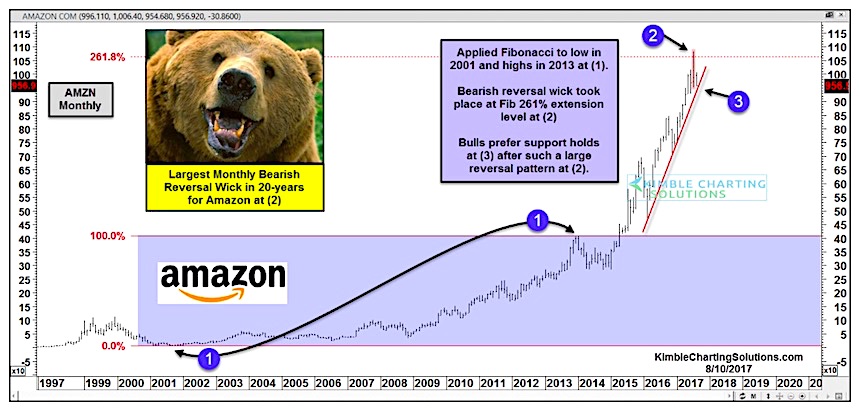
This reversal was one of the largest price reversals for Amazon stock over the past 20 years.
If we take a closer look at the chart, we can highlight a few things going on with Amazon’s stock price (now and historically). Using the lows in 2001 and highs in 2013 (marked by the numbers 1 below), we can apply a 261% Fibonacci Extension (see red dotted line and number 2). This is exactly where the bearish reversal candle (and long wick) came into play.
As well, that reversal took Amazon’s stock price down to a test of its sharp rising uptrend line (point 3). Bulls want to see prices hold at this trend line… especially after such a big reversal.
Amazon “Monthly” Stock Chart – Bearish Reversal Pattern To Watch
Twitter: @KimbleCharting
Any opinions expressed herein are solely those of the author, and do not in any way represent the views or opinions of any other person or entity.
: Creating Bullish Divergence?")


 and Semiconductors (SMH): Concerning Price Pattern?")


