Alternative Investments are sexy. This wide-ranging asset class, which includes hedge funds, structured products, private equity or anything that is materially different to traditional equities or bonds, has an air of exclusivity.
Managers in the Alternative Investments space range from the reclusive to those who host their own news conferences.
The television series Billions – described as a financial drama about people who think they’re in a Quentin Tarantino movie – isn’t based on a long-only equity portfolio manager who loves dividend stocks, it’s a hedge fund shop!
Beyond the fanfare, Alternative Investments offer a rather compelling reason for investors to consider inclusion in their portfolios. These wide-ranging strategies often create a performance stream that is materially different to traditional equities and bonds.
Including Alternative Investments within a portfolio can enhance diversification.
The Credit Suisse Hedge Fund Index (Chart 1 below – see the purple line) provides a proxy for hedge fund or Alternative Investment returns over time. This is an asset-weighted index of all hedge funds over a certain size.
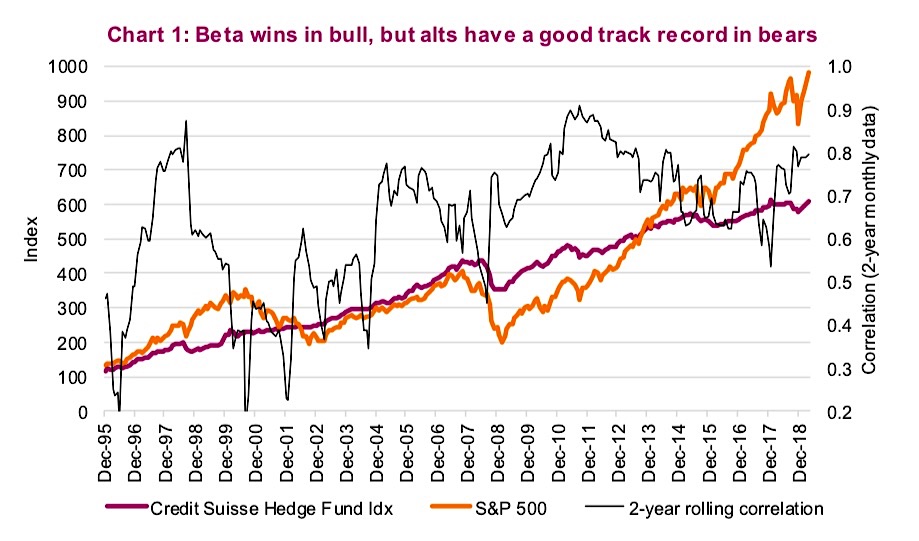
While returns have not been as robust as U.S. equity market returns (yellow line), it has been a much smoother ride with less volatility. Also worth noting, the correlation between equities and this hedge fund index tends to be lower during periods of equity market weakness (black line dipping lower during corrections/bear markets).
It’s evident that the correlation between the hedge fund index and equities has increased over time. Correlations, on average, were much lower in the 1990s- early 2000s, compared to the last decade. Perhaps this is due to the fact that more hedge funds today have greater market exposure, which is unfortunate from a diversification perspective.
Also important, this index contains many VERY diverse strategies ranging from long/short, global macro, event driven, market neutral, etc. This means a single hedge fund’s experience is likely very different than the index.
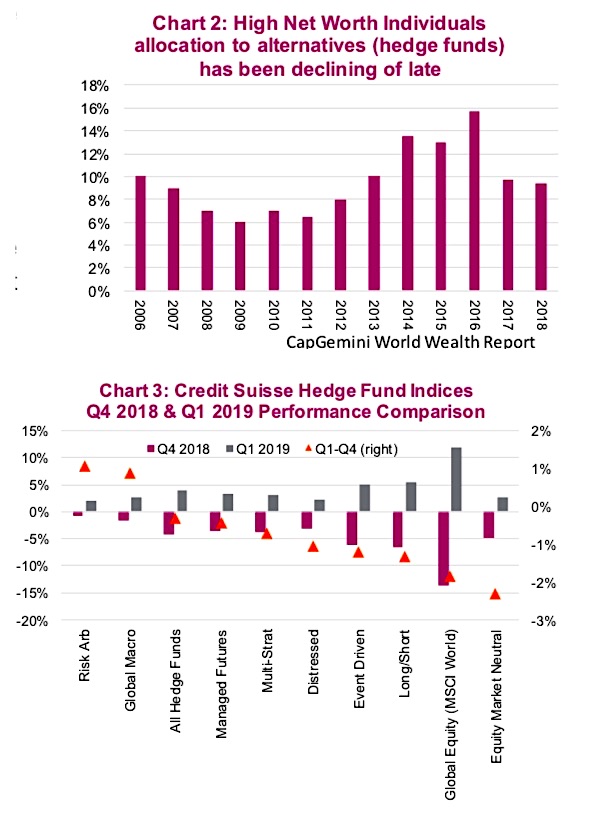
With such a strong run in equities and evidence that hedge funds are not as effective as a diversifier as they once were, the appetite for hedge funds has declined. According to the annual CapGemini World Wealth Report, high net worth investors increasingly adopted a higher allocation to alternative investments from 2009 to 2016. But after peaking at almost 16% of their overall asset allocation, their allocation to alternative investments decreased in 2017 and 2018 down to 9.4%. see chart 2 below
Part of this could be attributable to how well equity markets have performed over the past decade, in classic performance- chasing behavior. This declining trend is evident in hedge fund launches, which have been outnumbered by hedge fund closures in each of the past three years. Clearly, it is not as trendy to launch a hedge fund as it once was.
Q4 2018 vs. Q1 2019
In the last quarter of 2018 we experienced a strong market correction that saw the MSCI Global Equity index, a proxy for equities, drop 13.7%. Then in the first quarter of 2019, this index rallied by 11.9%. While this may be too short a time span for proper analysis, it offers a window into the efficacy of an Alternative Investment’s strategy to navigate a period of market weakness. It also highlights how that strategy performs in a strong up-market.
Chart 3 (above) contrasts how the different Credit Suisse Hedge Fund strategy indices performed during these two time periods (purple bar for Q4 and grey bar for Q1). The orange triangle represents the difference. You can easily see which hedge fund strategies helped protect during the painful fourth quarter, as those with the smallest declines such as “risk arbitrage” and “global macro”. And encouragingly, all strategies had a smaller draw down compared to the global equity markets. Conversely, all strategies had smaller up-market capture in the first quarter, which is understandable.
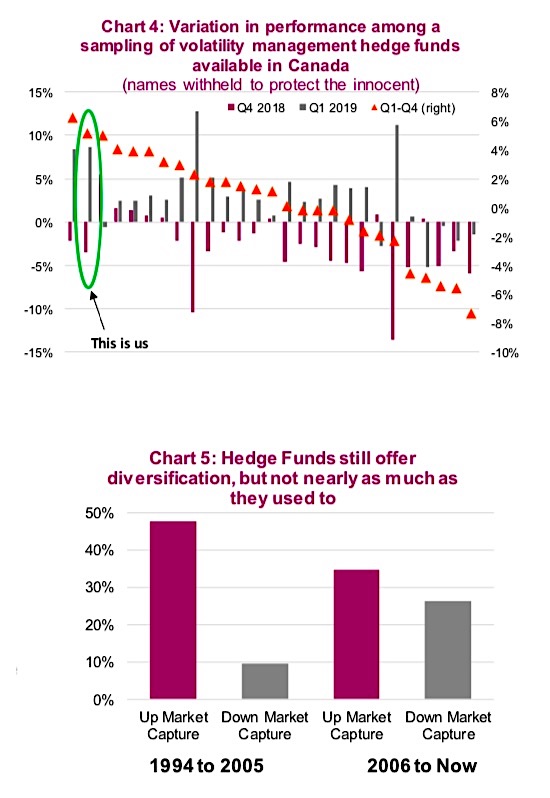
Remember, we indicated that among these strategy indices, there is a very high variation of returns from one fund to the next. We took a sampling of volatility- management hedge funds available in Canada and plotted their Q4, Q1 and Q1- Q4 performance. As you can see (chart 4 below), different strategies had very different results. And many of these strategies that are supposed to be strong diversifiers may have much more market exposure than one would expect. In fact, two of them look more like equity funds than hedge funds (two with the biggest purple & grey bars).
There is nothing wrong with this, but you should understand what you own and what you can expect in both bad and good times. From our conversations, some investors were surprised by how far their “defensive” strategies fell in the fourth quarter. The key to investing is to understand your exposure, how it fits into your portfolio and what can be expected – this makes for happier investors.
Maybe hedge funds just aren’t as hedgy anymore
Many professional investors now believe that hedge funds (or Alternative Investments) are not as “hedge fund-like” as they used to be. Perhaps as more managers opened up hedge funds, they started gravitating to more traditional market exposure; Or since equity markets have been on a tear for so long, many have been lured to adding more market exposure to their strategy.
We measured monthly up-and-down market capture for the Credit Suisse Hedge Fund Index and broke it into two periods: 1994-2005 and 2006 until now (chart 5 above). The underlying strategies scored differently – some providing more diversification and some less. But the recurring theme for all was a material decline from the respective time periods (1994 to 2005; and 2006 to now).
One final piece of evidence that hedge funds appear to be changing is the hedge fund holdings themselves. 13Fs are the quarterly required filings for hedge funds in the U.S. and they have to report their holdings. Bloomberg amalgamates these reports across all funds that file and you can easily see the top holdings. The top holdings in order are Microsoft, Altaba (a closed-end fund that provides exposure to Alibaba), Facebook, Amazon, Alibaba, Alphabet (C), Celgene, Alphabet (A) and Visa. That is a helluva lot of beta (aka market exposure).
Investment thoughts
Hedge funds and Alternatives can provide a very different performance experience compared to traditional equities or bonds. And many have proven track records, weathering periods of market volatility in good fashion. However, given how the markets have changed and the fact that there are many more hedge funds to choose from, it has never been more important to understand the process and exposure of individual managers and funds.
All charts are sourced to Bloomberg L.P. and Richardson GMP.
Twitter: @ConnectedWealth
Any opinions expressed herein are solely those of the authors, and do not in any way represent the views or opinions of any other person or entity.


