Earning season kicked off this Monday with Alcoa Inc. (AA). AA beat earnings forecasts, but revenue came in short. This resulted in Alcoa’s stock selling off and in the process approaching its 2009 lows.
The S&P 500 also declined and tested the lower bounds of its years-long channel. However, it is worth noting that the integrity of the S&P 500 years-long channel remains intact.
We could argue that Alcoa simply confirmed what many have already suspected coming into the earnings season: lots of bad news coming out of China and Europe over past several months. And now we look to the banks earnings this Friday for confirmation.
But the question surrounding the banks earnings is: Will they confirm that the economy is still in okay shape or that the global headwinds that we have been worrying about are getting the best of us.
S&P 500 Index – Monthly Chart
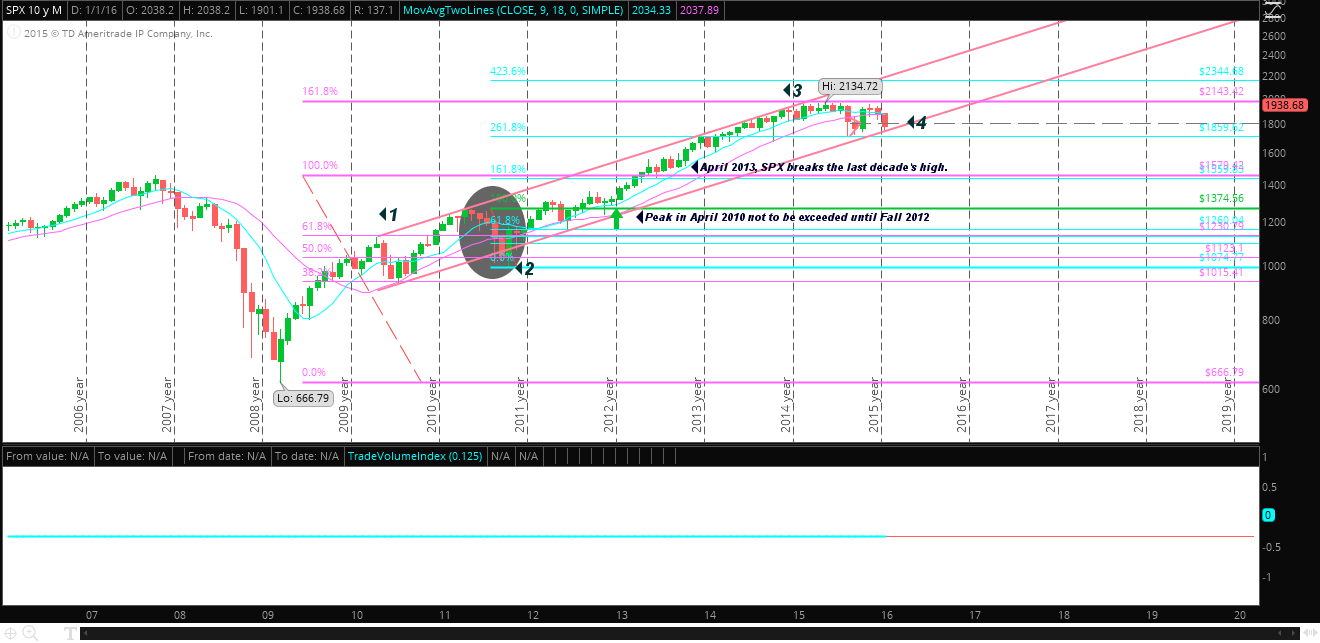
Chart from Think or Swim
The Fed Raises the Federal Funds Target
Despite bad news coming out of China and Europe, the Fed announced this last December that it was raising the federal funds target for the first time since October 2008, in accordance with its views that the economy has and is expected to continue to expand in the U.S. However, the positive Federal Reserve outlook has been eclipsed by global uncertainty.
Although, it is worth noting that the Volatility Index (VIX), a measure of market uncertainty, peaked leading up to AA’s report, and as of this writing, is once again on the decline. Just in time for a series of banks earnings reports.
On Friday, a number of banks earnings reports will be released including Blackrock, Inc. (BLK), Citigroup (C), PNC Financial Services (PNC), US Bank (USB), and Wells Fargo (WFC). While Fridays are generally slow days in the market, this time the banks earnings may prove pivotal, confirming or not the Fed’s outlook.
Below is the yield for the U.S. 10 Year Treasury. The U.S. 10 Year Treasury Yield is important to follow because it serves as the benchmark for many bank products including mortgage rates. Looking back, we note that Financials and Cyclicals peaked around the fall of 2013, equities market later moved into the latter part of the business cycle with Utilities and Energy leading for the first half of 2014.
Finally, in January 2015, the market began rotating once again into Cyclicals and Financials (see my summer articles on Sector Rotation). This lead was cut short last summer. On the global front, the Eurozone headed into negative interest rates early in 2015, demonstrating their continued stumbling recovery, and in the summer, China began its own market sell-off. By August, oil had breached a six-year low, and served as a catalyst from our own market sell-off. Since then, the S&P 500 has traded relatively sideways, failing to resume its previous upward trend.
U.S. Treasury by CNBC.com
In December the Fed raised the federal funds target for the first time. This positive outlook by the Fed did not serve as the catalyst, as some might have hoped, to finally move the markets higher. Instead, the yield on the U.S. 10 Year trended down, putting pressure once again on the banks, with margins being squeezed. This is because banks borrow short to lend long. It is approaching the 2% support level that has been tested three times since the general market sold off this last August. In kind, a number of banks reporting earnings Friday are approaching their 52 week lows – i.e. Wells Fargo (WFC) below.
Wells Fargo Stock Chart (WFC)
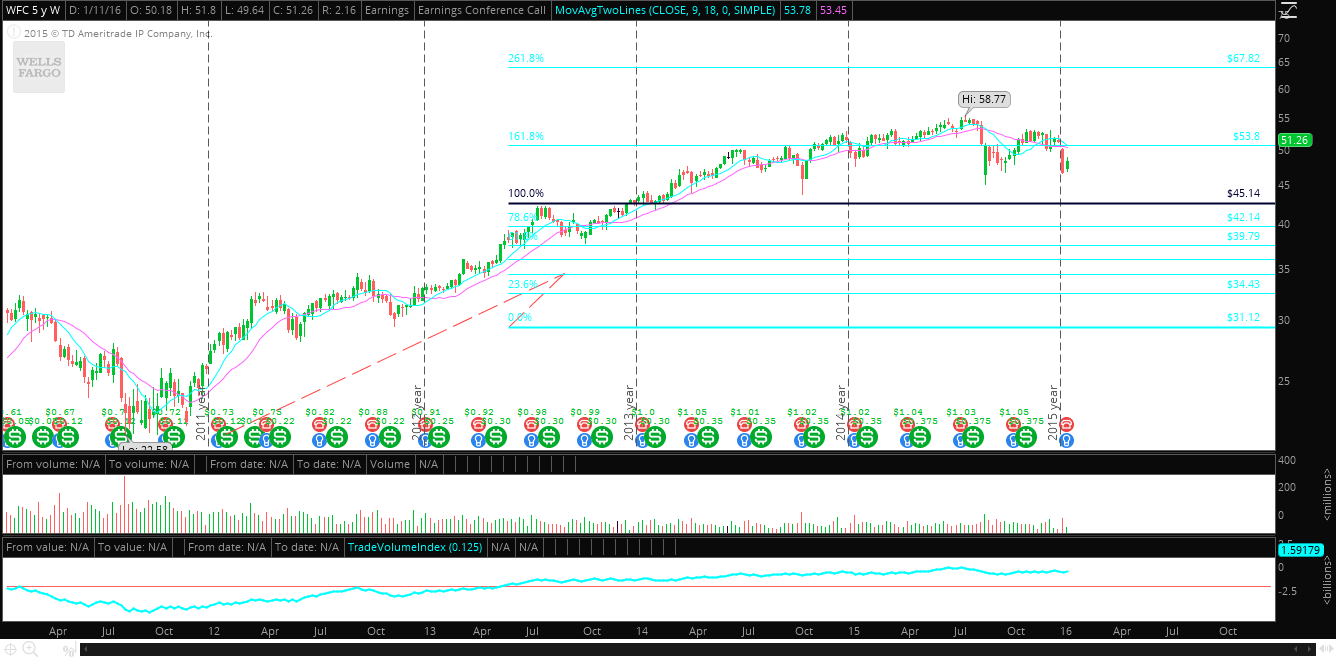
WFC Weekly Chart by Think or Swim
All eyes will be on the banks earnings this Friday to see whether their years’ low will continue to serve as support, and whether the U.S. 10 Year Treasury yield can remain above the 2% benchmark. Wells Fargo will carry the most weight as it has huge exposure to the housing and mortgage sector.
The U.S. 10 Year falling below the 2% benchmark would likely trigger a further sell off for bank stocks that will encourage more downward pressure for the general market, which is already testing the lower channel support (see SPX chart above). Alternatively, the U.S. 10 Year Treasury bouncing off again from the 2% bench mark and positive earnings from the banks would keep the Bears at bay, at least until the next round of earnings reports.
Twitter: @rinehartmaria
No position in any of the mentioned securities at the time of publication. Any opinions expressed herein are solely those of the author, and do not in any way represent the views or opinions of any other person or entity.

: Showing Some Signs of Emerging Strength")
