If it seems like just about every asset class is expensive, then you’re probably paying good attention to reality.
Our indicators show a curious situation where 3 of the major asset classes; stocks, treasuries, and property, are all overvalued. There’s a couple of good reasons why this has come to pass, and there’s a few important implications for investors.
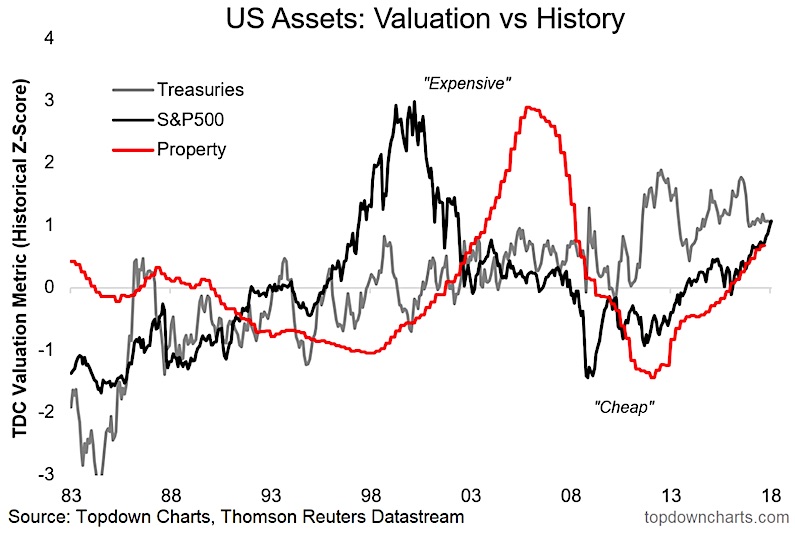
The chart comes from a presentation on Active Asset Allocation in 2018 and was featured, interestingly enough, alongside a chart which showed investors’ portfolio allocations to cash were at the lowest level on record.
The chart of interest: valuation indicators across 3 majors asset classes. See below
First a quick bit of explanation. All three assets have their valuation indicator standardized to make for better comparisons (z-scores). Property valuation is using the price to income and price to rent ratios. Stocks is a blend of forward PE, trailing PE, and the PE10. And treasuries is a blend of factors including real yields, term premia, economic cycle and mean reversion indicators.
But the bottom line is that all 3 are showing up around 1 S.D. more expensive than usual. A rare situation.
The extraordinary monetary policy experiments since the global financial crisis have played a big role in creating the conditions where this type of situation could emerge. Central bank buying of bonds has helped drive overvaluation in that asset class, along with the search for yield due to the various NIRP and ZIRP policies encouraging investors to dump cash and chase assets. And as a result equities and property have likewise benefited.
The endgame of these experiments remains to be seen. As a rule of thumb, over the medium term the odds are progressively stacked against you as asset valuations rise. Add to that the fact that the global monetary policy tides are turning as the global economic/inflation cycle matures, it makes for a challenging investment environment.
To be sure, the valuation indicators in this chart could well end up going further into to overvalued territory, and the experience of stockmarket and property valuations in the late 90’s and mid 2000’s respectively is informative. This is why it pays to keep the broader picture in mind, because the cycle is not over yet.
Twitter: @Callum_Thomas
Any opinions expressed herein are solely those of the author, and do not in any way represent the views or opinions of any other person or entity.


