 Risk is not a number. Risk is simply overpaying for an asset.
Investment managers who avoid overpaying for assets increase their odds of purchasing fruitful investments and limiting their drawdowns when investments turn against them. Shunning overpriced assets helps one generate steadily growing investment returns which has proven to be one of the most effective ways to grow wealth over time due to the underappreciated power of compounding.
While this approach sounds straight-forward, investment prudence is typically disregarded in frothy markets such as we have today and also when markets are in the grips of fear as was most recently experienced in the financial crisis of 2008/2009. In our essay “To Win, the First Thing you have to do is not Lose”, we documented how the volatility of investment returns can significantly hamper portfolio growth over the long term. In particular it stressed that large percentage losses require even larger percentage gains to simply recover original losses.
This article takes a unique, common-sense approach to describe the current market’s expectations for earnings growth in order to gauge the reasonableness of market valuations and ultimately prices. This analysis is intended to help determine whether the currently elevated Cyclically Adjusted Price to Earnings Ratio (CAPE 10) reflects overly optimistic prospects causing investors to “overpay” for assets or is it an assessment based on realistic earnings expectations reflective of a market that is fairly priced or possibly undervalued. This determination is important for investors to understand as CAPE 10, like most market valuations statistics, is currently at an extreme when viewed through the prism of historical market valuations.
CAPE 10 and its value
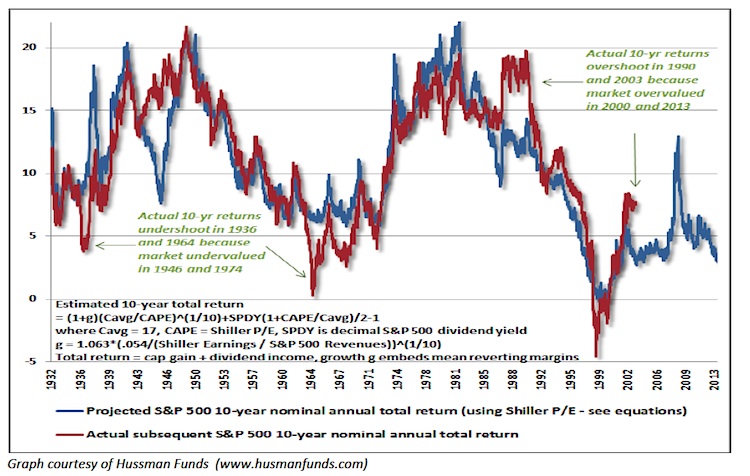
Robert Shiller’s CAPE 10 stands out amongst price to earnings (P/E) calculations in that it incorporates earnings over ten year periods, while most other P/E measures use forecasted future earnings or a relatively short period of recent earnings. The longer time frame used in CAPE 10 provides a better measure of earnings sustainability, and according to Ben Graham and David Dodd, offers a more dependable earnings proxy. It is this approach to earnings valuation that makes CAPE 10 a successful indicator of future market returns over time. The graph below, from John Hussman of Hussman Funds documents the strong correlation between CAPE 10 and future 10-year equity returns and emphasizes the durability of this approach.
CAPE 10 Correlation with Future Market Returns
The following table from “The Humility of Rates and the Arrogance of Equites”, compares prior CAPE 10 readings to the average GDP in the two years following each CAPE 10 measurement. Not surprisingly, the worst S&P 500 performance occurred when CAPE 10 was high and subsequent economic growth was weak. The best returns are achieved when a low CAPE 10 was followed by strong economic growth. The current CAPE and GDP expectations are highlighted by the box at the bottom right. The numbers in the table are annualized, so doubling the results produce the potential 2-year total return.
2yr Annualized S&P 500 Returns at Various CAPE 10/GDP Combinations
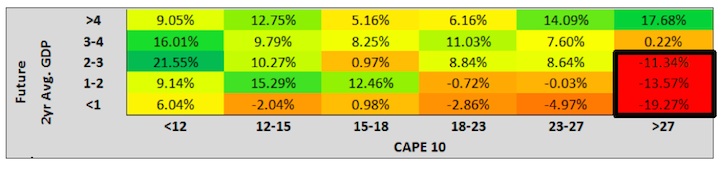
Data Courtesy Robert J. Shiller, FRED, Standard & Poors and Bloomberg
The graph and table highlight that the odds of good returns are clearly in the investors favor when CAPE 10 is low and they decrease significantly when it is elevated.
CAPE 10 today
Before detailing the results of the analysis, the graph below offers a current perspective of CAPE 10 valuations.
CAPE 10
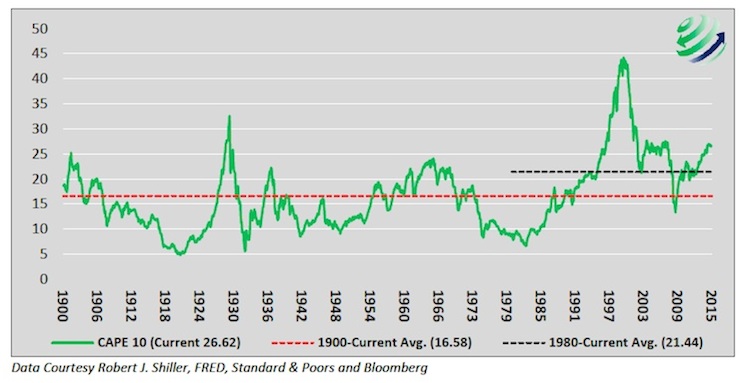
Presently, CAPE 10 is at a level seldom witnessed. CAPE 10 is on par with levels preceding the 2008/09 financial crisis and eclipsed only by the 1990’s technology bubble and the Great Depression of the 1930’s. In each of these other instances the ultimate drawdown from the peak was over 50%! The red dotted line highlights average CAPE 10 since 1900 and the black dotted line the average since 1980. The shorter time period starting in 1980 was included as some analysts prefer to rely upon the “modern era” as a baseline for analysis. The modern era includes the technology bubble which produced unparalleled CAPE 10 readings. If one excludes data from the heart of the technology bubble (1995-2001), the average CAPE 10 for the “modern era” drops from 21.44 to 18.60 during this era, closer to the 16.58 average since 1900. Compared to the full time series and the shorter “modern era”, current CAPE 10 is 60% and 24% overvalued respectively and 43% overvalued when the technology bubble is excluded from the “modern era”. Based on the current CAPE 10 ratio, investors have overly optimistic expectations for future earnings growth and are willing to pay premiums rarely seen in over 100 years. Alternatively, investors might simply be unclear about the risks they are assuming, confused by the market distortions created by the Federal Reserve’s zero interest rate policy and quantitative easing.
CAPE 10 Analysis
The formula used here is similar to that applied in “Shorting the Buyback Contradiction” and is employed to measure earnings expectations. The formula assumes no change in the stock price (the numerator), and then calculates the rate at which earnings (the denominator) must grow in order for the market’s current P/E ratio to match its historical average. It quantifies the earnings that investors require over a given time period. With an understanding of expected annualized earnings per share (EPS) growth, one can better determine the validity of the current premium paid for each dollar of earnings versus what investors have historically paid for each dollar of earnings. To quantify the market’s assumption for earnings growth we compare the current CAPE 10 ratio to the average CAPE 10 ratio over the aforementioned time frames.
The table below summarizes the results. Regardless of which data set (1900 or 1980 to current) one uses and which term (3 or 5 years) one selects to allow earnings to grow, currently required EPS growth is multiples of what has occurred over the last 3-5 years. U.S. Gross Domestic Product (GDP) growth, a large driver of corporate earnings, sends the same message – expectations for future performance are way too optimistic against recent observations. That is not to say these rates of growth are impossible, but the probability seems quite low and one should question the likelihood given weak economic conditions. Using the observations since 1900 in the table below to help interpret the data, annual EPS must grow 13.78% over the next 5 years to normalize the current CAPE 10 with its historic average. This is nearly double the 7.64% annualized EPS growth and 4 times the 3.45% annualized GDP growth over the prior five years.
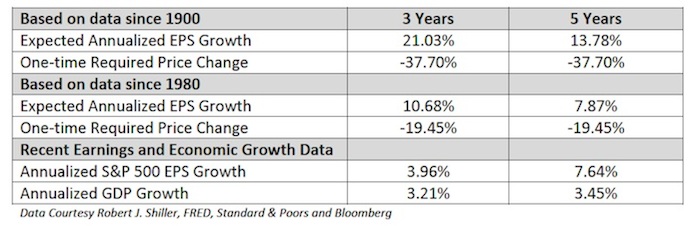
As opposed to solving for expected earnings as we discussed above, one can also normalize CAPE 10 by keeping EPS fixed and solving for the one-time change in price that would bring the current CAPE 10 to its historical average. Those figures (-37.70% and -19.45%) are also shown above (note they are one time price changes thus identical both time periods). Readers are heavily cautioned that during an economic and market downturn these figures likely underestimate the potential losses. If earnings drop, as is common in recessions, the price change required to normalize would be larger than shown. Furthermore, markets rarely retrace to fair value, which is to say they have a tendency to over-correct further extending the downside risk.
Summary
- In the long run investment success is attained through a steady stream of growing investment returns coupled with the compounding of those returns
- The CAPE 10 ratio and many other valuation techniques are at extreme levels rarely seen in history
- Historical precedence foretells large drawdowns at current CAPE 10 levels
- The earnings estimates embedded within current CAPE 10 readings are likely unrealistic
- The combination of a normalizing CAPE 10 and a concurrent decrease in earnings would be problematic for share prices
- Wealth preservation should be top of mind for all investment managers, especially given the extreme market valuations.
When paying a premium for equities, or any asset for that matter, one runs the serious risk of capital impairment. Worse, most professional investment managers falling prey to the bullish sentiment currently surrounding this period of extreme market valuations will likely not live up to their overriding fiduciary duty – the preservation of wealth.
Following the herd may have its benefits at times, but following the herd over a cliff never ends well.
Ending in the words of Seth Klarman: “Risk is not inherent in an investment; it is always relative to the price paid”.
Thanks for reading.
Twitter: @michaellebowitz
Any opinions expressed herein are solely those of the author, and do not in any way represent the views or opinions of any other person or entity.

: Showing Some Signs of Emerging Strength")
