Last weekend I posted daily and weekly charts on StockTwits of the 10 Year Treasury Note (TNX). As a follow up, I’d like to use this blog to provide an update and open a dialogue about rates over the short and long term. So let’s take a look at that 10 Year Treasury Note Yield.
The chart below serves two purposes: one is clearly for dramatic effect, while the other is to illustrate how powerful a retest pattern can be when it is accompanied by follow through. Korey Bauer wrote about bond yields yesterday and highlighted that the 10 Year Treasury Yield is up over 65% since May 1 and nearing some pretty stiff resistance.
10 Year Treasury Note Yield Index (TNX) – Daily Chart
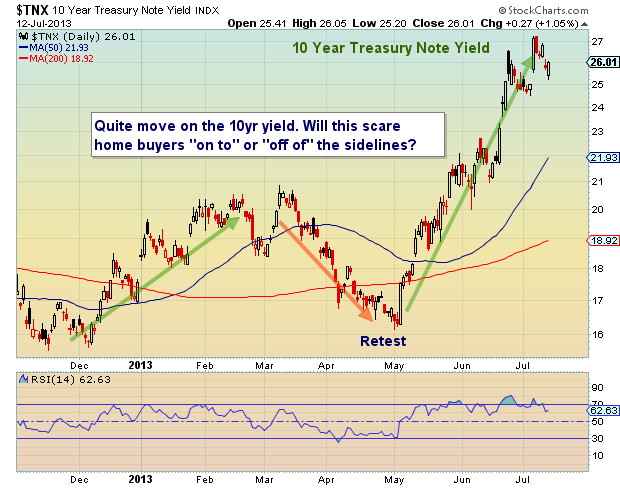 The question within the chart (above) is more of an intermediate term question pertaining to real estate. Clearly if rates continue to move higher at this pace, buyers will remain in their shells. However, if rates consolidate, or even move higher at an incremental pace, buyers may return and hang around for another year or two (locking in at a lower rate for fear of a continued move higher). But the Goldilocks concept is often a fleeting one for investors.
Also read Naufal Sanaullah’s Market Masters article: “Preparing for Rising Interest Rates”
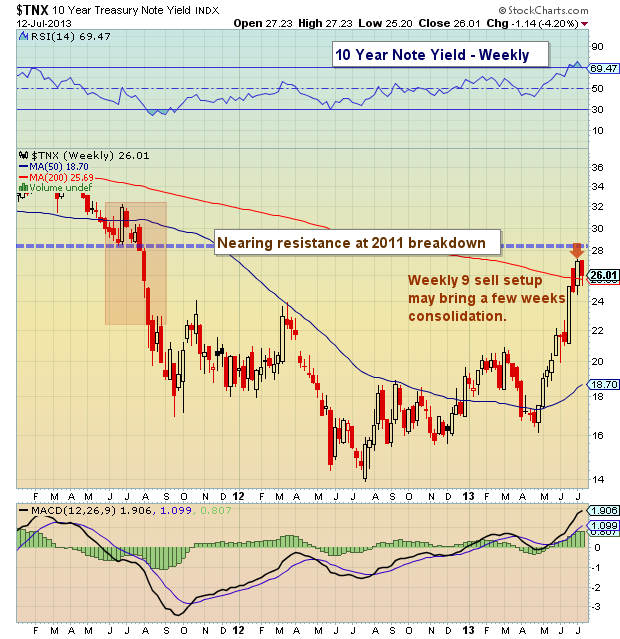
That said, below is a weekly chart highlighting the weekly sell setup 9 (DeMark) that occurred the week ending July 5th; this week’s pullback may have been the start of a larger consolidation/pullback. Of even greater importance is the overhead resistance at the 2011 breakdown (2.85 to 3.00). This affords yields a bit more room to the upside over the near-term (if the tank still has gas), but also marks a clear resistance divider from which bond yields will need to sustain a break higher to start a longer term bull move. Similar resistance was highlighted in Korey’s article.
How deep of a pullback or how long of a consolidation remains to be seen. BUT, one thing is clear: yields are demanding our attention.
10 Year Treasury Note Yield Index (TNX) – Weekly Chart
Feel free to comment below – thanks for reading. Trade safe, trade disciplined.
Twitter: @andrewnyquist and @seeitmarket
No position in any of the mentioned securities at the time of publication.
: Worrisome to Broader Market?")

: Important Breakout Retest")

