 First, I want to note that I agree with the masses that bond yields (interest rates) are ultimately going to be higher over the next few years. That said, on a 2 to 3 month basis, I think the masses are going to be surprised by a move back lower in bond yields.
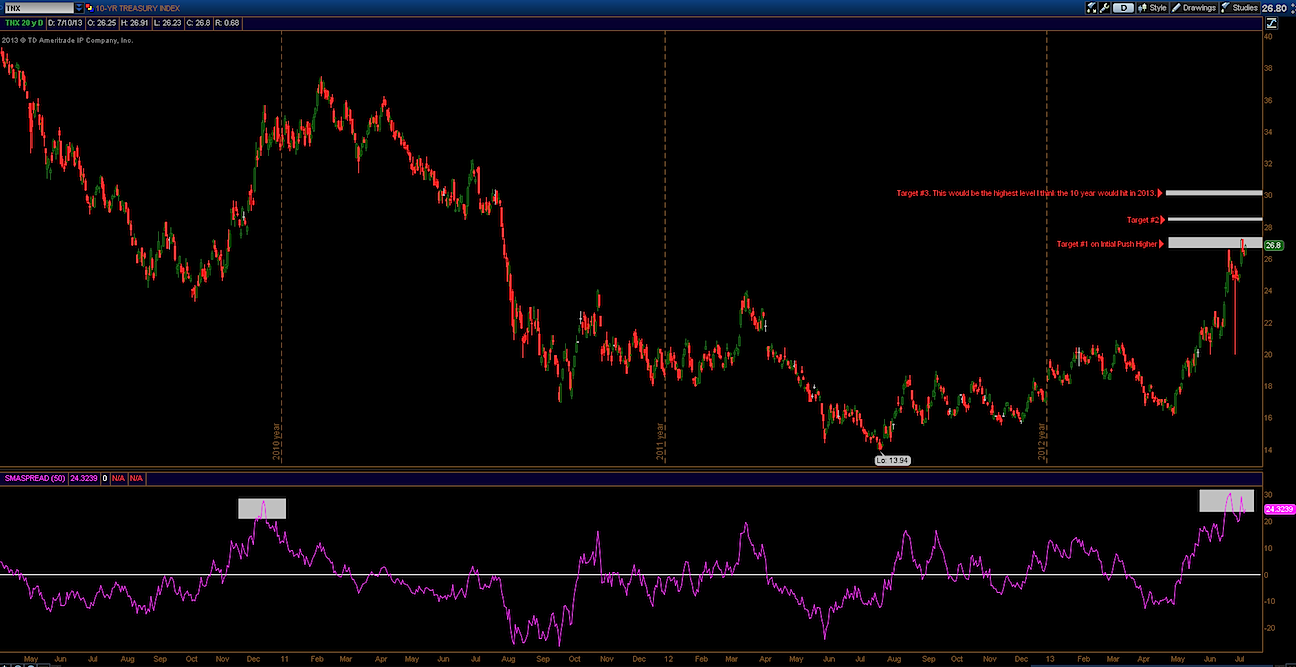
Since the low on 5/1/13, the 10-year treasury (TNX) has moved over 68% from the bottom. That’s a pretty significant move in bond yields! Take a look at the chart below where I highlighted 3 potential targets for this up move. The first target was met around the 2.72 level, which I think it will be a tough resistance level to crack. If we do break above 2.72, I think a move between 2.84-3.02 would put in a new incremental high which I believe will be the top for at least couple of months following a test of those levels. Furthermore, the spread between the current market prices and the 50 day moving average is very wide. The last time we saw this spread on the 50 SMA was back in late 2010, when we made a new high before bond yields plunged to new lows. Click charts to enlarge.
10 Year Treasury Index
I think a lot of traders and analysts knew that a move up in rates was going to occur at some point, but the continued strength of the move has surprised many.
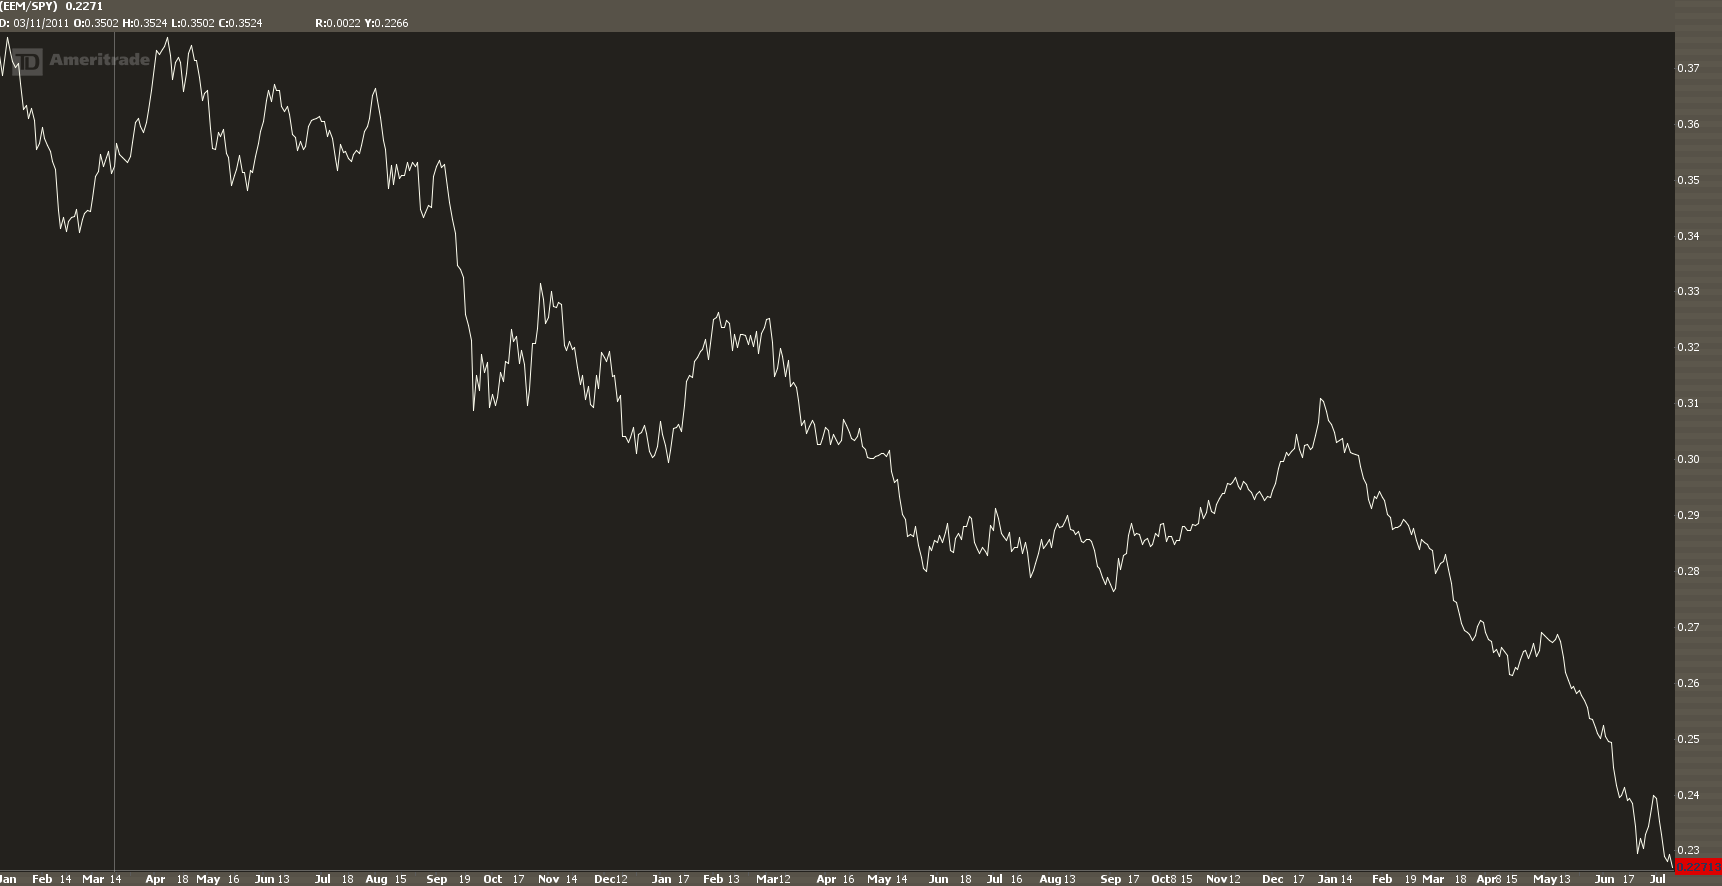
So, were there signs prior to the move higher in bond yields? I think the significant underperformance of Emerging Market equities/debt was the tell that there was a sense of a “taper” in the future. Even from March until early May when yields fell back to 1.60 on the 10 year, Emerging Markets (EEM) still failed to sustain any bid in the market. The ratio chart below depicts Emerging Markets relative to the S&P 500. When the emerging markets are weaker, (relative to the S&P 500) the ratio will move lower and vice versa.
Emerging Markets ETF (EEM) : SPDR S&P 500 (SPY) Chart
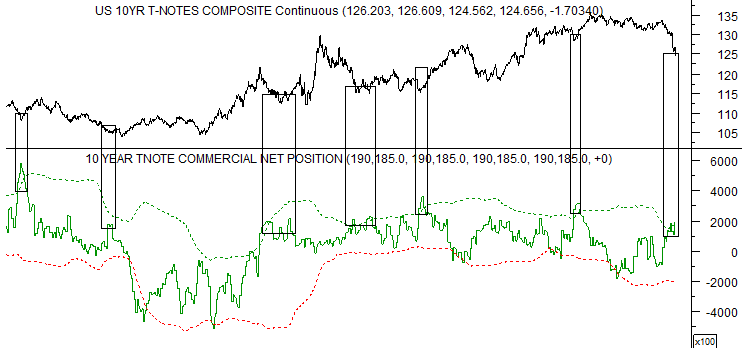
Lastly, if we take a look at the C.O.T. (Commitment of Traders) for the 10-year treasury, one can see the amount of commercial buyers (smart money) of treasuries stepping in here to buy the dip while retail investors are selling. The black boxes are areas where the commercial traders have bought in the past and it usually led to a low in the near future.
Commitment of Traders Report (C.O.T.) – 10 Year Treasury
Thank you for reading.
Disclaimer: The material provided is for informational and educational purposes only and should not be construed as investment advice. All opinions expressed by the author on this site are subject to change without notice and do not constitute legal, tax or investment advice. At Castle Financial, securities are offered through Cadaret, Grant & Co., Inc. and TD Ameritrade, Inc. Members FINRA/SIPC.
Chart sources: C.O.T. Report and TDAmeritrade
Twitter: @stockpickexpert and @seeitmarket
No position in any of the securities mentioned at the time of publication.
Any opinions expressed herein are solely those of the author, and do not in any way represent the views or opinions of any other person or entity.


