The Fed raised rates 25 bps The decision was unanimous.
The terminal rate projection is unchanged at 5.1%
FOMC statement modifies guidance: “The committee anticipates that some additional policy firming may be appropriate.”
My first tweet @marketminute this morning before the market opened:
“I feel pretty certain Powell goes 25. Announces theyre willing to keep raising at that rate as jobs strong, economy ok & banks arent in a credit crisis. However, as data dependent, they could change course accordingly. $SPY remains in a trading range. Until next fracture appears”
“And then there’s $sugar looking like it’s about to continue the rally higher. Food prices will remain elevated. And the Fed remains stuck between the damage done but the root of inflation far from fixed.”
My tweeted response after the FOMC?
“5% yields create more stress to labor market.
Does nothing for riding food prices and global inflation.
Silver is outperforming gold.
Sounds like Stagflation”
The daily chart of silver shows the price rising further away from the 50-daily moving average in blue.
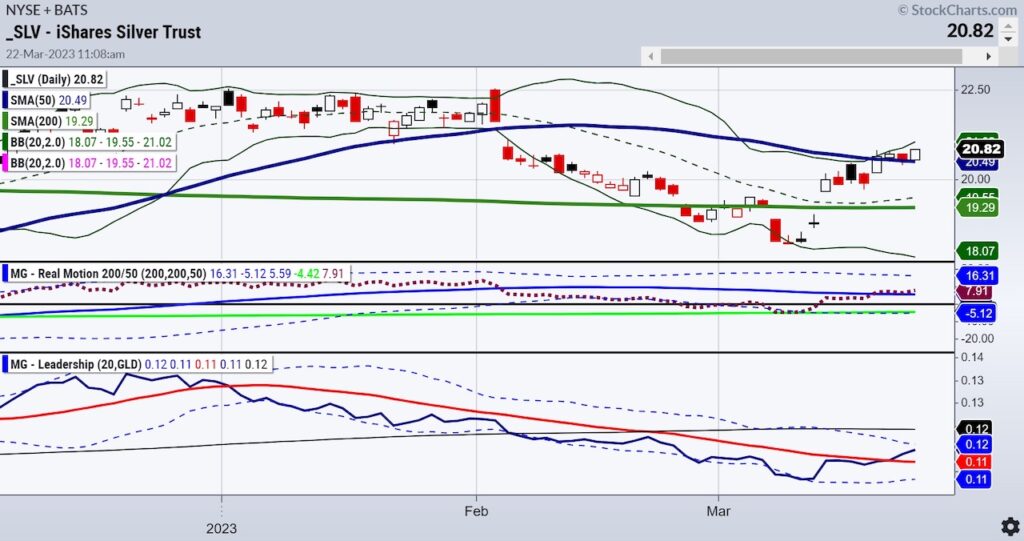
The Leadership indicator shows that Silver is beginning to outperform gold.
That in and of itself is highly inflationary.
The Initial response in the indices was to buy as investors only hear “pivot”.
Powell: Intermeeting data on jobs and inflation came in stronger than expected. We considered pause, but the hike was supported by strong consensus.
You hear pivot? I hear considered-quite different.
Which is why it is not only important to watch how silver performs relative to gold, but also how bonds perform relative to the S&P 500.
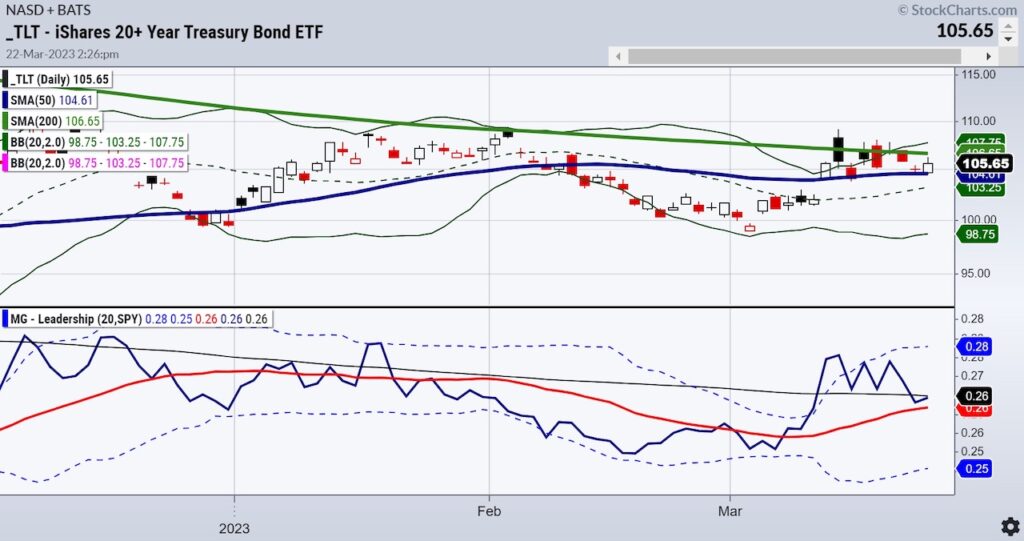
Long bonds are outperforming the S&P 500. The Daily from March 12th called Long Bonds: Island Bottom and the Signal of Chaos covers this potential in detail.
That is typically recessionary.
So, if you add up rising gold, silver, cocoa, sugar, copper, steel maybe oil prices, along with long bonds showing yields might have topped and then add that the bonds are doing better than the market (SPY)—that equals Stagflation.
But the real issue is we have not seen the full impact of the Fed and CBs losing control.
And the dollar is weak.
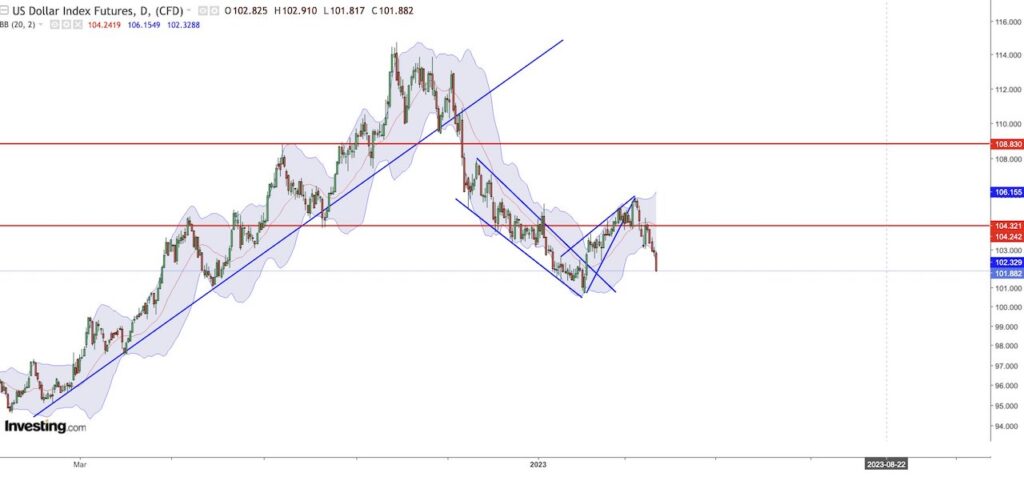
A perfect storm?
Stock Market ETFs Trading Analysis & Summary:
S&P 500 (SPY) 400 pierced for a minute, now back to resistance 390 pivotal
Russell 2000 (IWM) 170-180 range now
Dow (DIA) Could not hold the move over 324 the 200-DMA
Nasdaq (QQQ) 328 is the 23-month MA resistance and now a bit overbought on the indicators-
Regional banks (KRE) 44 support 50 resistance
Semiconductors (SMH) will watch for a key reversal to the mean w/ 250 support
Transportation (IYT) Holding the 200-WMA 219 but has to clear the 200-DMA at 224
Biotechnology (IBB) 127.50 resistance
Retail (XRT) 60 big support and 64 big resistance
Twitter: @marketminute
The author may have a position in mentioned securities at the time of publication. Any opinions expressed herein are solely those of the author and do not represent the views or opinions of any other person or entity.


