Crude oil futures peaked on July 6 and has weighed heavy on investors minds, specifically those directly trading futures or involved in energy stocks.
Crude oil is also a solid indicator for the economy. And in this light, the decline in crude oil prices has triggered concerns about the economy (and potential reaction to the Delta variant).
With this in mind, we will turn to the chart of the SPDR Energy Select Sector ETF (XLE) and highlight why bulls need to see a strong reversal soon… or risk being mired in selling supply for the coming weeks.
Note that the following MarketSmith charts are built with Investors Business Daily’s product suite.
I am an Investors Business Daily (IBD) partner and promote the use of their products. The entire platform offers a good mix of technical and fundamental data and education.
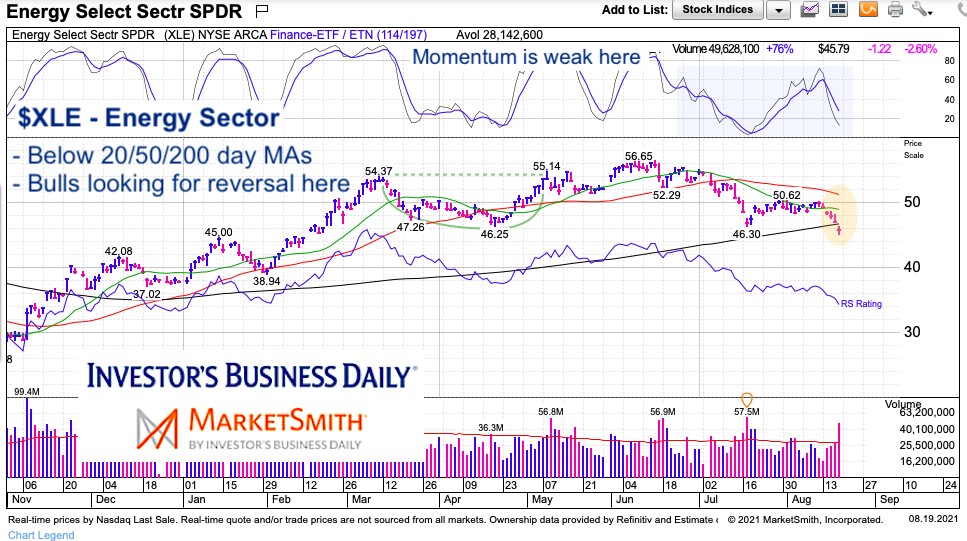
$XLE Energy Sector ETF “daily” Chart
Momentum is weak and price is trading heavy. Yes, that is a bit of hindsight… but what this really means is that rallies will likely see selling at overhead resistance. 46.50 is the 200 day moving average (MA) and strong price resistance exists in the 49-51 zone.
This is no doubt a tricky spot for traders. We are oversold but price has closed below the 200-day moving average (MA). Bulls would like to see a reversal here that recaptures the 200-day MA. This would present an opportunity to trade up to the 49-50 level. Bulls need more constructive behavior to expect more than that right now.
Twitter: @andrewnyquist
The author may have a position in mentioned securities at the time of publication. Any opinions expressed herein are solely those of the author, and do not in any way represent the views or opinions of any other person or entity.
")


")
