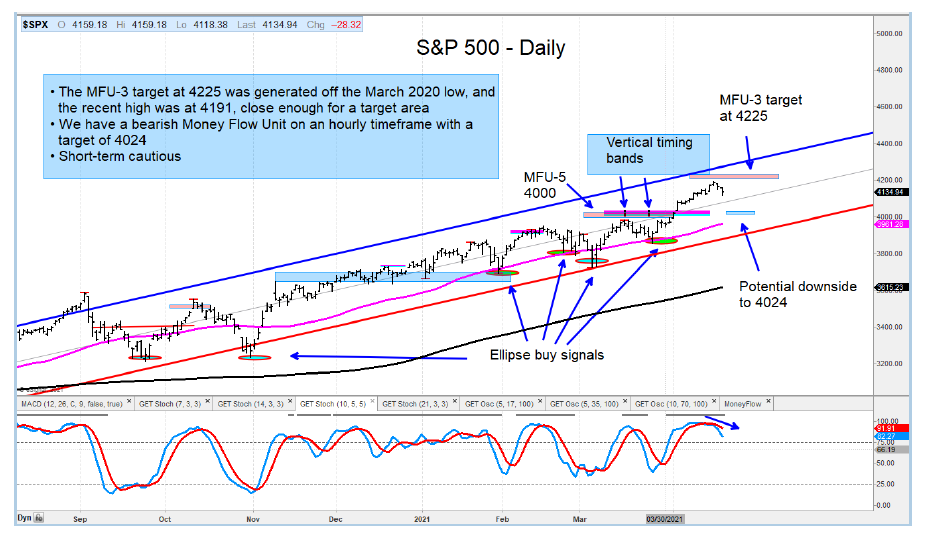
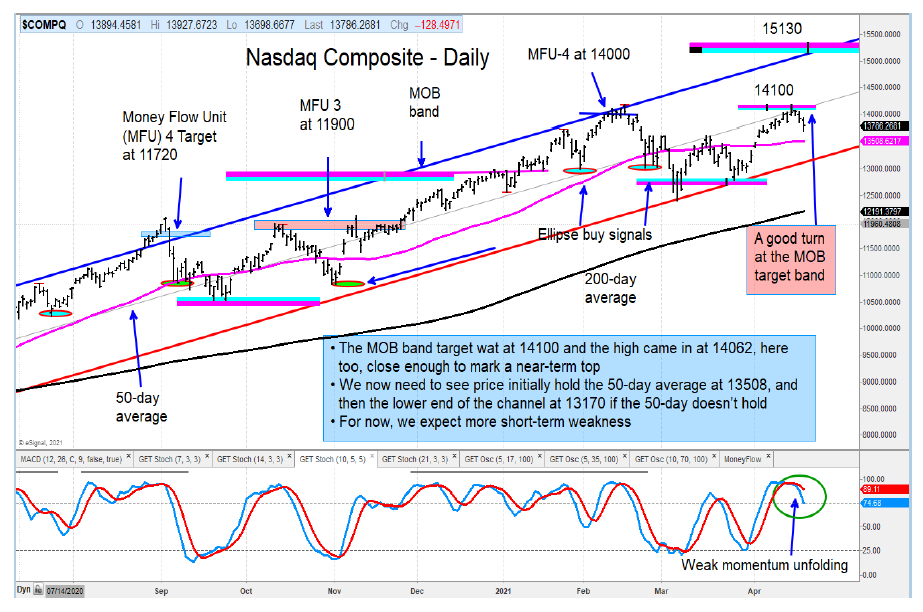
Investors saw the major stock market indices reverse from key price target zones this week. We are cautious but watching to see if there is further deterioration before turning bearish.
Reversal patterns took shape from at or close to target zones on the S&P 500 Index, Nasdaq Composite, and the Mid Cap Index. We are also dealing with the ‘sell in May’ seasonality that is right around the corner.
The Russell 2000 has formed a bearish Head & Shoulders top, and we are looking for more weakness from here. The chart of the IWM relative to SPY on page 12 shows the relative weakness of small caps to large.
The Mid Cap ETF (MDY) shows the index reversing at the upper end of its regression trend channel.
The Dow Utilities are getting close to our MOB target, as shown on page 9.
The Industrials ETF (XLI) turned at our MFU-4 target, a zone to be trimming.
Upside momentum in Gold is expanding. I still see more upside in Gold from here.
The author or his firm may have a position in mentioned securities at the time of publication. Any opinions expressed herein are solely those of the author, and do not in any way represent the views or opinions of any other person or entity.


 Ready To Break Out?")
