It’s no secret that small cap stocks have under-performed large cap stocks for most of the past decade.
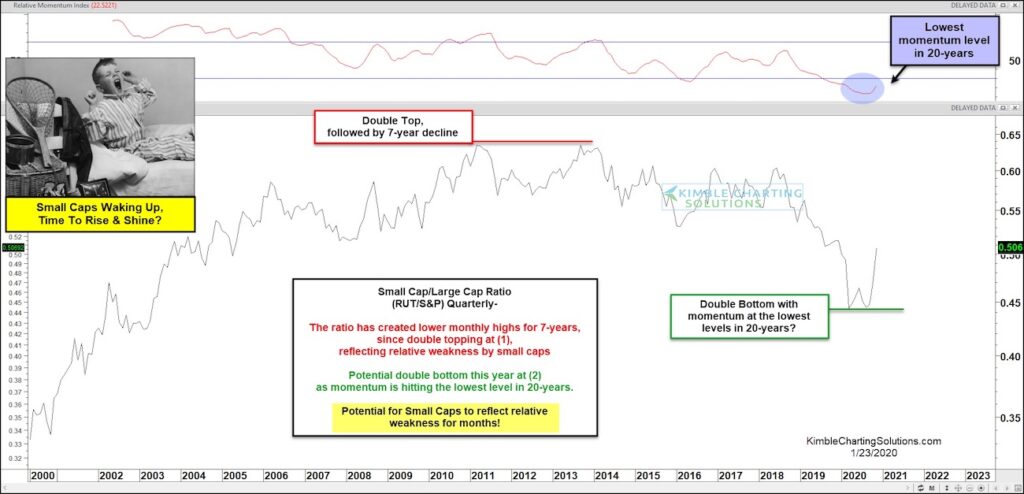
Today’s chart highlights the past 20 years of the Russell 2000 Index (of small cap stocks) vs the S&P 500 Index (of large cap stocks) on a “quarterly” basis. This ratio created a double top pattern in 2010 and 2013 at point (1) and turned lower for the ensuing 7 years.
BUT, notice the recent “U” turn higher for small cap stocks?
Small Caps waking up after a 7-year nap?
A potential bullish double bottom pattern is forming at (2) as small cap stocks have begun to out-perform large caps.
This turn higher is also occurring after the momentum hit its lowest level in 20 years.
Looks like small cap stocks are waking up… and it may be time to rise and shine! Stay tuned!
Note that KimbleCharting is offering a 2 week Free trial to See It Market readers. Just send me an email to services@kimblechartingsolutions.com for details to get set up.
Twitter: @KimbleCharting
Any opinions expressed herein are solely those of the author, and do not in any way represent the views or opinions of any other person or entity.


