The sharp decline in tech stocks has run deeper than the broader markets and is now well into correction territory.
Looks like a case of follow the leader on the way up (and it went WAY up), is going to be follow the leader on the way down… at least initially.
On September 8th, I wrote about the short and long term Fibonacci retracement price support levels to watch on the S&P 500 Index. Today we will look at the Fibonacci support levels on the Nasdaq 100 Index.
We will also use these in conjunction with other broad technical indicators such as moving averages and trend lines to highlight important zones to watch.
Note that the following MarketSmith charts are built with Investors Business Daily’s product suite.
I am an Investors Business Daily (IBD) partner and promote the use of their products. The entire platform offers a good mix of technical and fundamental data and education.
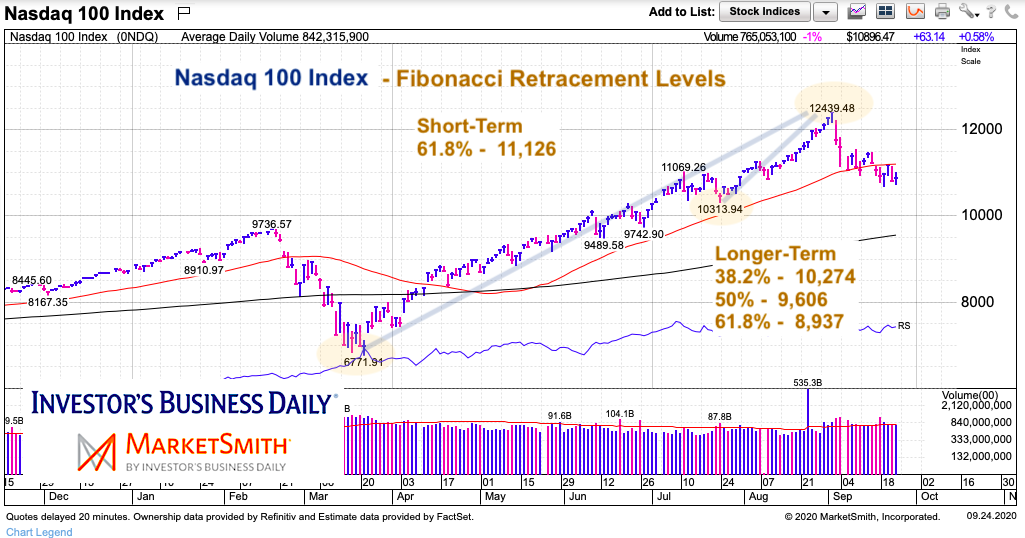
Nasdaq 100 Chart with Fibonacci Retracement Levels
I like clean charts that aren’t too messy and get straight to the point. In this case we are looking at the current decline in the Nasdaq 100 Index. As an active investor, I follow hourly, daily, and weekly timelines on trades but each operates the same and the trading plan is simply dictated by price variables (trend, moving averages, fibonacci levels, breadth, and candlestick action.
In today’s chart we zoom in on Fibonacci retracement levels. On a short-term basis (July low to recent high), we have already declined below the 38.2 and 50 percent Fibonacci levels. BUT the 61.8 Fibonacci retracement provided support. I’m not surprised. The index is trying to carve out a bottom but will need to rally past its 50 day moving average to confirm a legitimate bounce. Should we head lower yet, we will need to be aware of the longer-term Fibonacci support levels (February lows to recent highs). The 38.2% Fib is at 10,274. I think this level is really important. A push below this level in the weeks ahead would likely see a drop all the way to the 200-day moving average (in my opinion).
The trend off the February lows was also violated during the early September 3-day whoosh lower. With this in mind, enjoy the bounce… but know that we are vulnerable here after falling out of trend and into no-man’s land.
Twitter: @andrewnyquist
The author may have a position in mentioned securities at the time of publication. Any opinions expressed herein are solely those of the author, and do not in any way represent the views or opinions of any other person or entity.


")