In May, stock markets continued their relentless rally out of the “corona-crisis”, latching on to any and all reasons to rally after sliding precipitously in March.
Most major stock market indexes have now recovered a large portion of their spring selloff.
Optimism over reopening and vaccine developments continue to influence sentiment.
The S&P 500 Index rose 4.8% in May, and the S&P/TSX Index climbed 3.0% – respectable returns amid a recessionary backdrop.
The S&P 500 is now just down 10.4% from its February high. Should we bid farewell to the bear market?
If the coronavirus was the accelerant of the overdue recession, the markets appear to have gotten over both with the NASDAQ now up 5.8% year-to-date followed by the S&P down just 5.8% and the TSX down 11.0%. This rally has been relentless.
It’s not just a North American phenomenon – the European market is up strongly but Emerging markets continue to struggle. Currency weakness is a large driver, as the MSCI Emerging Markets Index finished the month largely flat as the virus continue s to spread largely unabated, notably in Brazil.
The COVID-19 pandemic has led to an increase in confrontational rhetoric between the U.S. and China, with Hong Kong right back in the middle of the war of words. These geopolitical tensions which markets obsessed over in 2019, have so far had little impact on sentiment. Perhaps it’s just talk for now, with little support across the political spectrum to increase tariffs in the middle of a recession. With the U.S. election coming up, the rhetoric will likely get louder.
The bond market has been incredibly quiet in May (See Chart 1 with flat-lined yields). After the big swings in bond yields over the past few months, the sense of stability has brought about a sense of relief for fixed income traders. Since mid-April, treasury yields have been locked within an exceptionally narrow band between 60-70 basis points (bps).
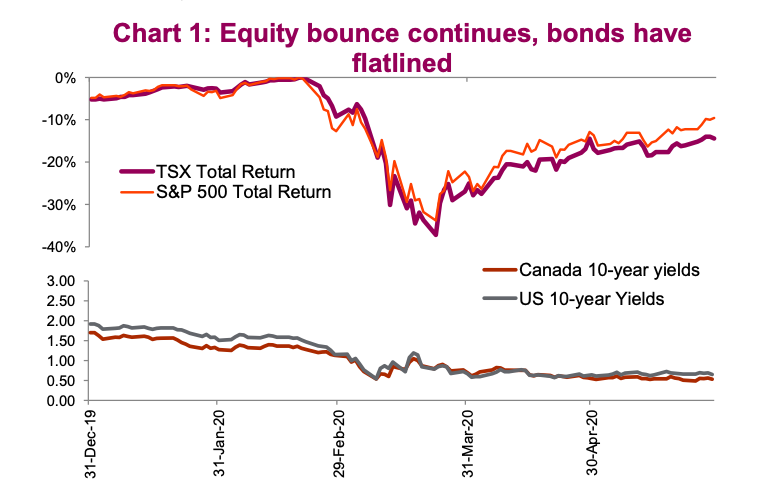
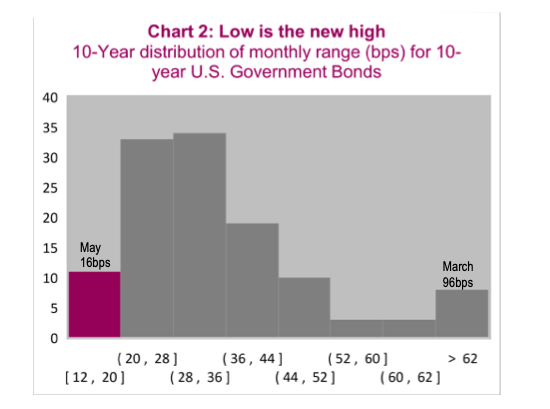
Chart 2 shows just how rare this lack of volatility is. The total range for U.S. 10-year bonds in May was 16bps, an occurrence almost as rare as the big swing in March. Looking back, the dislocation within the bond market in March was due to the large one-sided nature of flows. With the U.S. Federal Reserve (Fed) and other central banks now active buyers, both within the treasury market and now buying ETFs directly, there are now two sides to the trade. Credit spreads continue to narrow, led by investment grade bonds. The high-yield market continues to recovery, but not by the same degree.
The energy complex has come back in a big way. West Texas Intermediate (WTI) posted a 77% increase in May with gasoline prices up nearly 50%. Returns in base metals are mixed with copper leading the pack rising 2.8%. Precious metals continue to be in hot demand with rising interest among retail investors, but gold prices have been comfortable bouncing around the low $1,700s. Silver has been the big winner, up 20% this month, underscoring just how stretched the gold/silver ratio was in March/April. A gold to silver ratio of 97.3 is still historically stretched, nearly two standard deviations away from its 10-year average.
The major development within currency markets has been the broad -based weakening of the U.S. dollar. The DXY Index is back down to 98.2 and is nearing its lowest level in the past three months as it continues to give up its safe-haven gains during the peak of the viral fears.
A weaker U.S. dollar and stabilizing energy markets have benefited the loonie which is now trading back above $0.72 CAD/USD. It is still lower by over 6% compared to where it started the year, but the present valuations based on purchasing power parity show it is only 14% undervalued compared to levels which were much more extreme back i n March. At current levels, it’s difficult to have robust convictions in either direction.
While sentiment continues to improve, and the future is looking brighter than it did a couple of months ago, we remain concerned that the recovery in risk assets has possibly gotten ahead of itself. Valuations remain elevated, and the road to economic recovery will more than likely not resemble that path that equity markets have forged. Given the continued rise in markets, the potential f or near- term corrective action remains elevated. That being said, this continues to be a pretty unloved rally so far, which means that current positioning could continue to be a tailwind
Passing of the baton
In the back half of May there were signs of a broadening of the equity rally . This is likely more short-term in nature but has reinvigorated the debate between growth versus value. The pace of re-risking has been uneven with the rotation to strength moving further down the quality scale into sectors and industries that are far less resistant to economic weakness. This is either a sign of breadth/strength, or simply bargain hunting when the price of what you really want to buy is unjustifiable.
The current levels of some of the big tech and health care names is rather baffling. You can blame it on hedge funds or new retail day traders who have nothing better to do after being furloughed. Baskets of retail favorites are showing some signs of irrational exuberance, but the same can be said for the NASDAQ as a whole which remains the bellwether bubble index. Keeping your eyes on this should provide a good glimpse into any souring of sentiment.
Around mid-May the rotation really took hold, as Chart 3 shows.
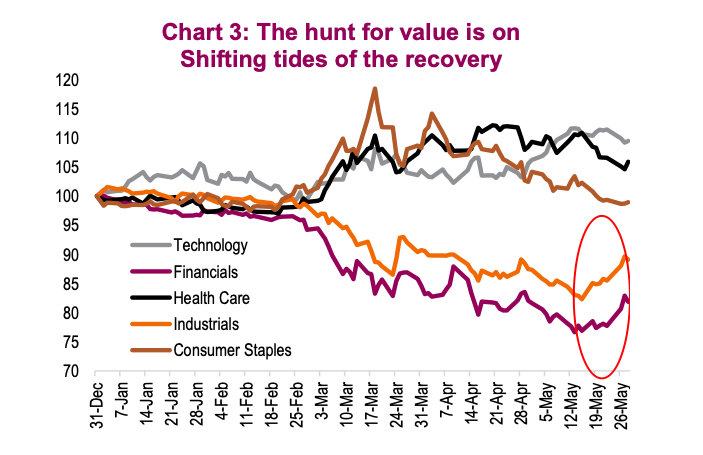
While the broader indices slowed their ascension, investors started to bid up sectors and industries that had been left behind during this bounce off the bottom. These are the sectors that bear the brunt of the damage as the recession plays out. While it’s often said the stock market is not the economy, there are certainly sectors of the market that are more closely tied to the economy.
Diversification is a common theme throughout this report. It’s important to
remember that it’s not really about growth versus value; it’s about finding the right balance of exposure across a multitude of styles and sectors. From a stock-specific standpoint, some sectors such as financials would certainly be bucketed into “value” while others such as tech or communication services are certainly growth.
Source: All charts are sourced to Bloomberg L.P. and Richardson GMP unless otherwise stated.
Twitter: @ConnectedWealth
Any opinions expressed herein are solely those of the authors, and do not in any way represent the views or opinions of any other person or entity.


