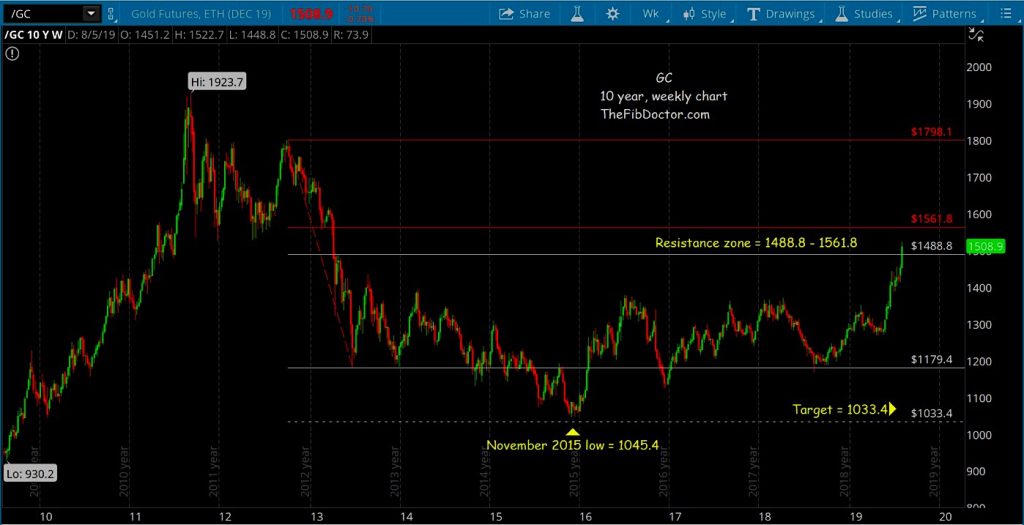
Gold bugs have had to wait 6 years to get to a very critical price resistance zone of 1488.80 to 1561.80.
In my opinion, 1561.80 is the key level for Gold to take another shot at 1900 and possibly higher. NYSEARCA: GLD
One factor you must keep in mind is that gold has had many, many reasons to “run” in the last several years, and didn’t. The old standard of gold being a “safe haven” seemed to have fallen by the wayside.
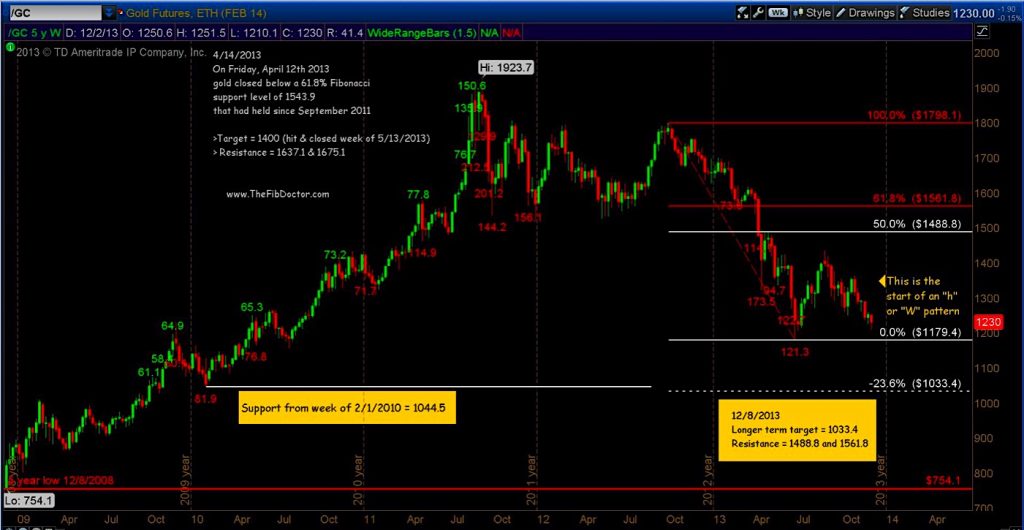
Let’s start with the original post I made in 2013. Take note of the posted support level of 1044.5 that comes from February, 2010. The low was put in at 1045.4, during November, 2015.
Now, let’s look at the original chart that was posted on December 8, 2013.
Now to the current chart. For three and one half years gold has traded sideways in roughly a $150 range. It began the current move upward in May/June of 2019 and has been able to get through the first resistance level of 1488.8, albeit only one weekly candle.
One thing you should take from this current chart is just how powerful, and accurate, correctly drawn Fibonacci levels are.
At this point, the best way to have an idea of what gold will do here is to drill down to a daily chart, with a secondary Fibonacci drawing, to gauge the reaction at support and resistance levels.
Twitter: @TheFibDoctor
The author may have positions in mentioned securities at the time of publication. Any opinions expressed herein are solely those of the author, and do not in any way represent the views or opinions of any other person or entity.
: Creating Bullish Divergence?")

 and Semiconductors (SMH): Concerning Price Pattern?")

: Creating Bullish Divergence?")