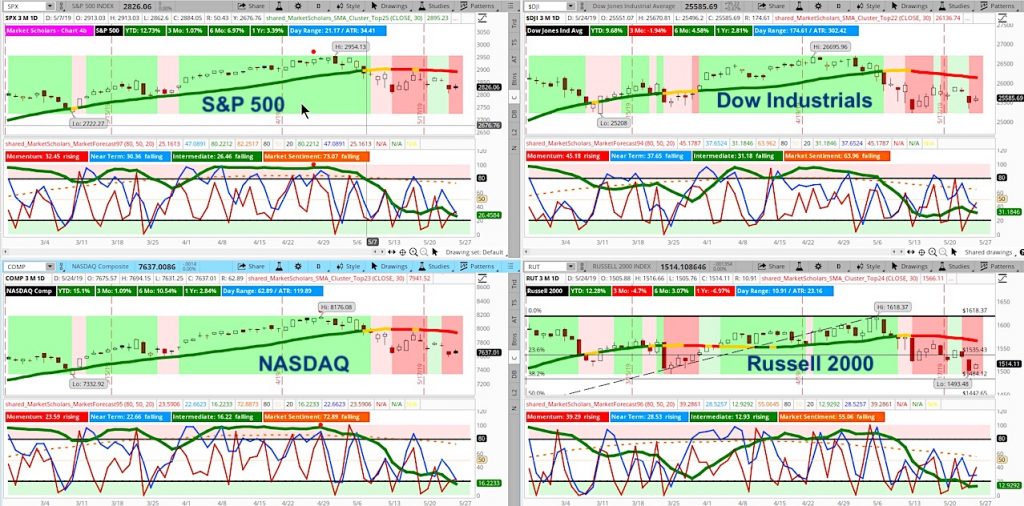
The S&P 500 (NYSEARCA: SPY) still maintains a bearish posture (green line on Market Forecast indicator – see chart below) with a weak bearish long-term Market Sentiment (orange line).
Short-term sentiment (the blue and red lines) have been bearish but not bearish enough to point towards a more protracted trend change to the downside.
The S&P 500 is trading near a confluence of support levels using Fibonacci retracements and Fibonacci fans of the bullish run that started late last year and the late March pullback that produced a weak intermediate low point. There’s also strong volume support near 2,800.
The seasonality chart for the S&P 500 points to positive price action into July expiration – even if the gains aren’t nearly as strong as they were early this year.
The Russell 2000 (NYSEARCA: IWM) NASDAQ Composite (NASDAQ: QQQ) show a more bearish intermediate posture but their short-term lines aren’t not confirming the break down towards other Fibonacci retracement levels.
All the weekly charts are showing bullish intermediate confirmation signals, which suggest there may be a bounce off support coming as early as next week. This pattern coincides with the Heikin Ashi weekly candles and the likelihood that next week could form a transition candle that leads to a rally in early June.
The MACD and Stochastic indicators are below their respective chart’s midpoints but, again, not to the extent that we should expect a pullback similar to last October.
This week’s trading range and volume were weak heading into the holiday weekend – another positive sign that we may be forming a bottom at support levels. Keep in mind, the bottoming process may be longer than normal simply due to the fact that the rally off late December lows was bigger and longer than normal.
Get market insights, stock trading ideas, and educational instruction over at the Market Scholars website.
Stock Market Video – For the Week of May 27, 2019
Some additional insights from today’s stock market outlook video:
- Another sign pointing to this being just an “exhale” before we start another intermediate run is the lack of volatile upside moves following the 1% and 2% down days, which is typical of the more protracted and steeper declines.
- Volatility remains subdued even though we are trading at lower levels that a few weeks ago when we experienced the VIX spike above 23.
- Over the past year, agricultural commodities have been the weakest asset class due to trade war jitters with the U.S. dollar and long-term Treasuries outperforming. But, the greenback was unable to hold a breakout above 98 for a second time in recent weeks. And, ag commodities bounced this week even without a trade deal between the world’s 2 largest economies.
- In fact, the relative certainty that we won’t get a trade deal any time soon may actually be a benefit for risk appetite as traders can now take their focus off Twitter and headlines and focus more on improving global economic indicators and earnings results.
- Crude oil’s weakness may be to blame for the current intermediate pullback. But, its own decline may be short-lived after falling to its own strong support levels.
- Rate cut odds keep moving higher and have now breached the 80% level for January. This has pushed the 2-10 yield spread closer to zero. Previously, this has actually been a bullish pattern for stocks heading into the actual first rate cut. Already, oversold international markets had a strong day to take advantage of renewed risk appetite and falling U.S. dollar.
- The strongest sectors continue to be the Real Estate, Utilities and Healthcare sectors. This pattern is typical of a forthcoming bounce in stocks with Cyclical sectors bouncing off oversold levels.
- Bullish trade example in Healthcare sector that has been underperforming but is showing renewed relative strength vs other sector with a stock showing bullish breakout pattern.
Twitter: @davidsettle42 and @Market_Scholars
Any opinions expressed herein are solely those of the author, and do not in any way represent the views or opinions of any other person or entity.


