So, we as investors are not in the fortune telling business.
But we as investors are in the fortune probability business.
Today, Federal Reserve Chairman Powell gave us a crystal ball of probability.
He fell, if you will, right into our palm reading hands.
With comments like – we are on pause until further notice on raising interest rates, waiting for inflation target to set in, the economy will quickly recover from the government shutdown, etc.,
What has the Federal Reserve done for our probable winning trades?
Remember this chart?
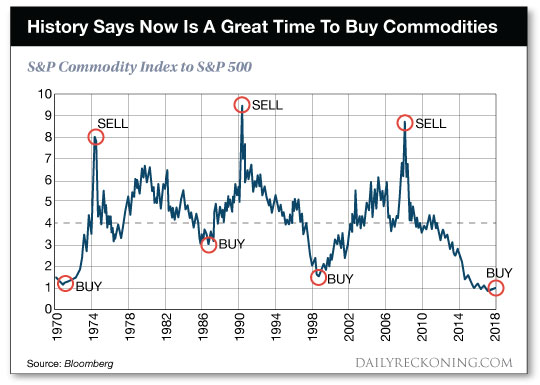
A wee bit out of date, it shows the 100-year historical low ratio between the S&P 500 and commodities.
If we updated it, we’d see commodities still near the lows, while stocks are down from their peak.
I know, equities, after the December dumpage have gone straight up.
Probability fortune telling?
That the ratio tightens more.
Here is another chart.
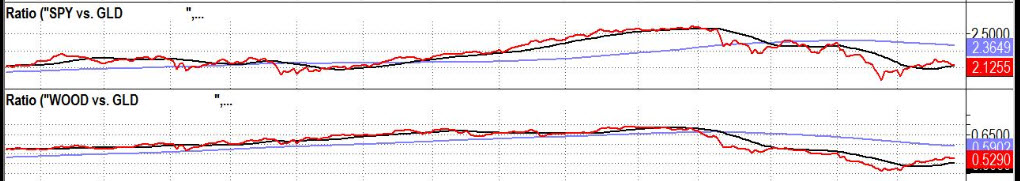
S&P 500 (SPY) vs Gold (GLD) – This ratio measures the relationship between the S&P 500 (SPY) and Gold (GLD).
Gold is often used as an anxiety index or safe haven and an alternative to paper currency. Gold does not have a high correlation to stocks and its relationship often shifts.
Currently, the SPY (red) to GLD (black) ratio has reversed with GLD starting to outperform.
Lumber (WOOD) vs Gold (GLD) – This ratio measures relationship between gold (GLD) and lumber (WOOD). When this ratio is trending up it indicates that the relative performance of lumber is improving versus gold.
Lumber is a key input into construction which tends to increase in strong or improving economic conditions.
Currently, WOOD (red) is outperforming, but that could flip as it did in October of last year.
Obviously, we do not need to be fortune tellers to see where the best potential lies.
GLD is telling us something. And if lumber declines while gold continues to incline, that too tells us something.
What has the Fed done for us?
Given us a high probability potential for profiting from theses trends if they continue to emerge.
S&P 500 (SPY) – 266.70 the top of the outside week high, is now the pivotal support. Then support at 265.50-under there would use more caution
Russell 2000 (IWM) – 147.54-147.92 is the range to clear. 146 are the nearest underlying support.
Dow Jones Industrials (DIA) – 248.55 now pivotal area with the 200 DMA at 249.82
Nasdaq (QQQ) – 165.65 pivotal area for tomorrow’s open.
KRE (Regional Banks) – 53.00 nearest support level to hold. 55 major resistance
SMH (Semiconductors) – 97.20 big resistance. 93.50 pivotal and 92 support
IYT (Transportation) – 180 pivotal number with 179.15 support to hold
IBB (Biotechnology) – 110 resistance with 106.00 support
XRT (Retail) – 44.75 the weekly resistance. 43.70 support to hold
Twitter: @marketminute
The authors may have a position in the mentioned securities at the time of publication. Any opinions expressed herein are solely those of the author, and do not in any way represent the views or opinions of any other person or entity.

: Showing Some Signs of Emerging Strength")
