LONG-TERM TRENDS
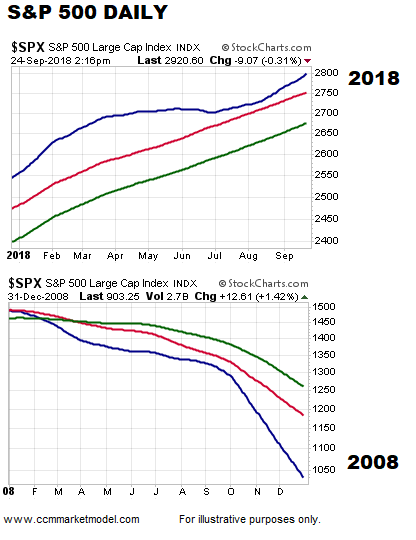
The facts we have in hand on Monday, September 24, tell us the market’s long-term trend remains constructive. The charts below show the 100, 200, and 300-day moving averages in 2018 and 2008.
POSSIBLE SUPPORT BELOW
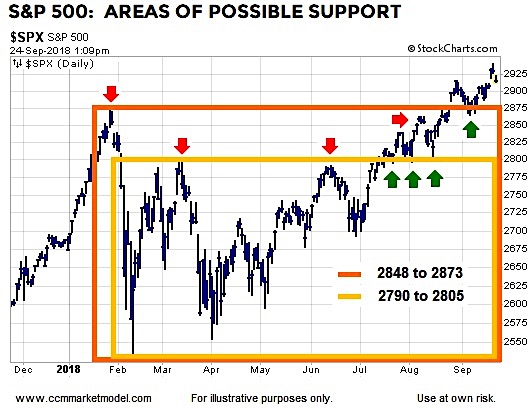
Since one of the hardest things to do is sit tight during normal volatility that regularly occurs within the context of a long-term bullish trend, it can be helpful to understand areas of possible support below the market. Price action has identified the 2848-2873 range as one area of possible support should the market decide to backtrack (see top of orange box below). If that range is violated, the top of the yellow box comes into play between 2790 and 2805.
RETRACEMENTS ARE NORMAL
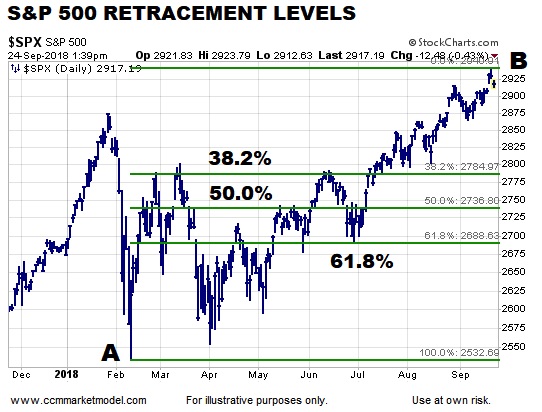
Markets often have “give back” periods within the context of an existing uptrend. For example, based on the intermediate-term bullish move off the February 2018 YTD low, it would not be unusual for the S&P 500 to retrace 38.2%, 50.0%. or 61.8% of the A to B move before going on to make a higher high above point B. If price stays below the 61.8% retracement, the odds of a bearish reversal would increase. For us, the moral of the story is there are numerous reasons to be patient during 100% normal and to be expected volatility within the context of an existing and ongoing uptrend (until the hard data says otherwise).
THE REALLY BIG PICTURE
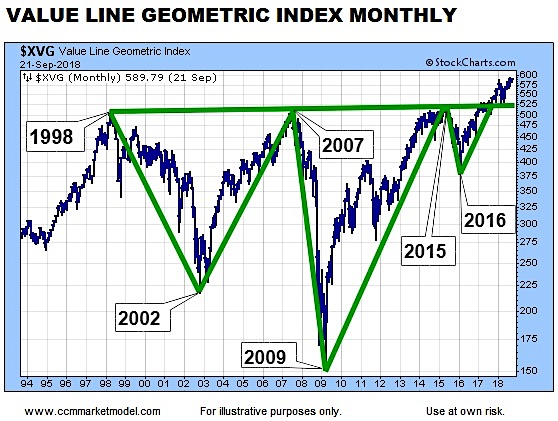
The average stock remains above areas of previous resistance that came into play in 1998, 2007, and 2015.
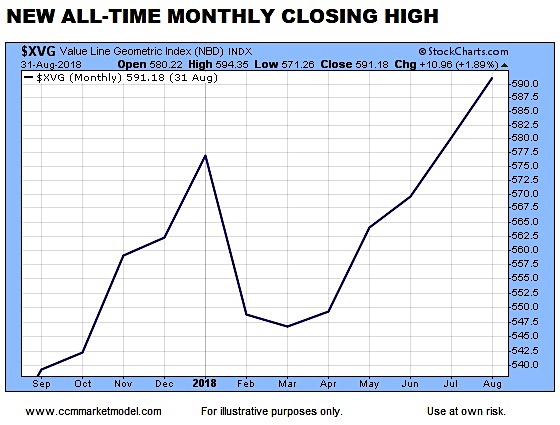
HARD TO CALL THIS BEARISH
The average stock just printed a new all-time monthly closing high last month. It is difficult to wedge this factual piece of data into a bearish argument for stocks.
MAXIMUM FLEXIBILITY
If the data on multiple timeframes begins to shift in a meaningful way, we must be flexible enough to reassess the long-term probabilities. We will continue to take it day by day.
Twitter: @CiovaccoCapital
The author or his clients may hold positions in mentioned securities at the time of publication. Any opinions expressed herein are solely those of the author, and do not in any way represent the views or opinions of any other person or entity.


: Showing Some Signs of Emerging Strength")
