In a recent discussion with a fundamental-biased market-participant, the question was asked “At what price level would you initiate or add-to short-positions in E-Mini S&P 500 Index Futures?”
Without referencing any of our technical analysis, our answer was to sell the next two-month high.
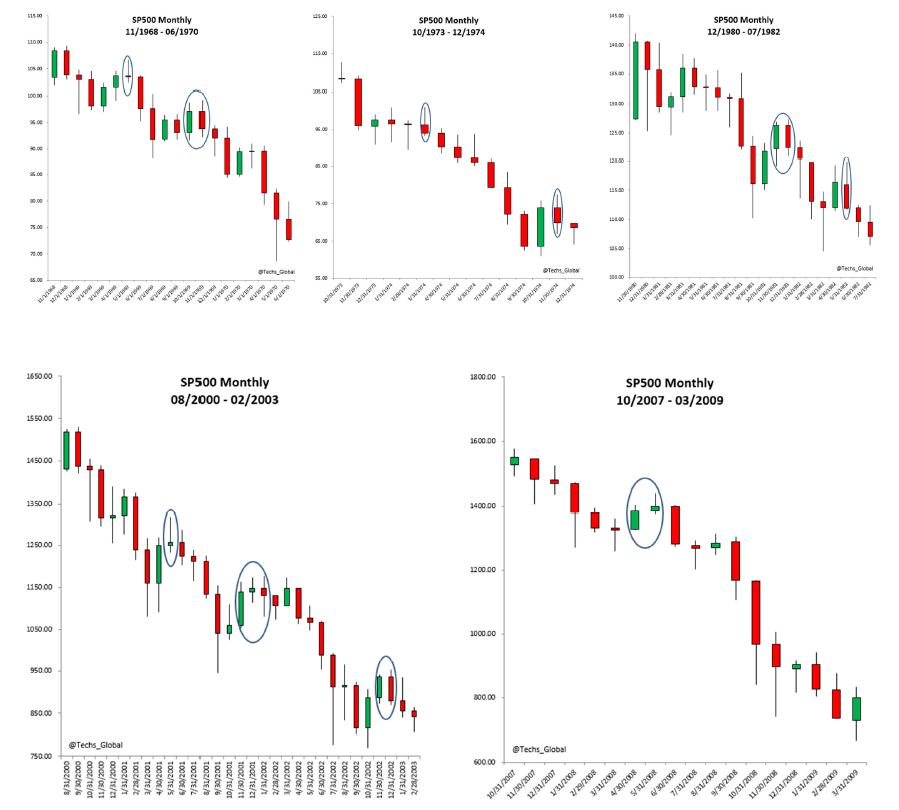
The following charts are monthly time-periods across five significant bear markets beginning in 1968.
In each, you can see that if you followed this simple strategy, your short-sales were never significantly challenged. In fact, these two-month highs occurred right before significant price-moves down in each respective bear.
In May, a two-month high for E-Mini S&P 500 Index Futures would be realized above 2807.25.
Patience, awareness, and discipline are required.
S&P 500 Futures “Monthly” Charts – Historical Bear Market Periods
Check out more of my research over at Global Technical Analysis. Thanks for reading.
Twitter: @Techs_Global
The author may have a position in the mentioned securities at the time of publication. Any opinions expressed herein are solely those of the author, and do not in any way represent the views or opinions of any other person or entity.


